Download
1 / 41
410 likes | 836 Views
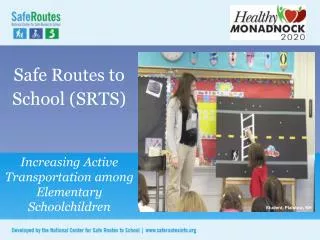
SAFE AND ACTIVE ROUTES TO SCHOOL INCORPORATING PHYSICAL ACTIVITY INTO THE DAILY ROUTINE DAVE JANIS Photo - What SAAR2S means to kids banner History of Safe Routes to School Many child pedestrian fatalities in Denmark, 1970s Denmark reduced casualties by more than 80%

E N D
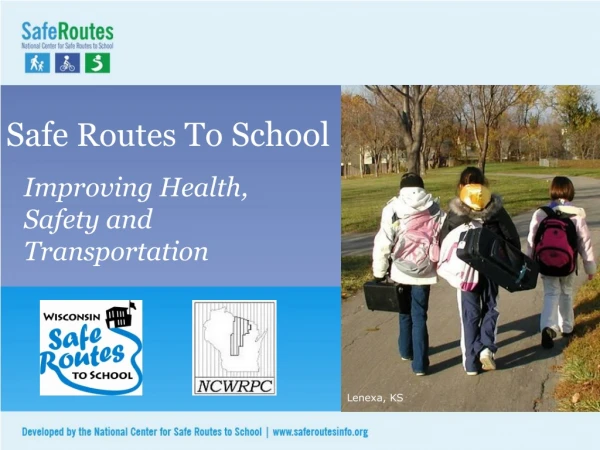
SAFE AND ACTIVE ROUTES TO SCHOOLINCORPORATING PHYSICAL ACTIVITY INTO THE DAILY ROUTINEDAVE JANIS
History of Safe Routes to School • Many child pedestrian fatalities in Denmark, 1970s • Denmark reduced casualties by more than 80% • Caught on in UK and Canada in the 1990’s; Bronx, NY in 1997
What Happened? • Individual barriers to biking and walking to school. • School siting issues. • Community issues.
Children’s Health • Motor vehicle injury is leading cause of death. • More than 3.8 million afflicted with asthma. • Excessive weight gain.
School Siting Issues Generation Ago • Schools averaged 127 students • Half of high school kids biked/walked. • Located in community centers.
School Siting Issues Today • Schools average 653 students. • 40 % of high schools have 1500+ students. • Schools located on 10 to 30+ acres on community fringes. • Lowest cost construction.
Community Issues • Traffic flow • Abandon buildings • Illegal behaviors
Individual Barriers to Biking and Walking to School • Long distances 55% • Traffic danger 40% • Adverse weather 24% • Fear of crime danger 18%
Photo Connecting Cul-de-sacs Before Connecting cul-de-sacs: before school No connectivity between school and neighborhood
Fear of Crime Danger • Kidnapping is less than 2 percent of all violent crimes against juveniles • Only 4 percent of all kidnappings occur in school vicinities • About 100 “stereotypical” kidnappings a year and 3,200 non-family abductions in the country
Community Involvement and Sustainability • Recruit stakeholders. • Keep it fun. • Don’t make it time consuming. • Work with the media. • Promote as good for the entire community.
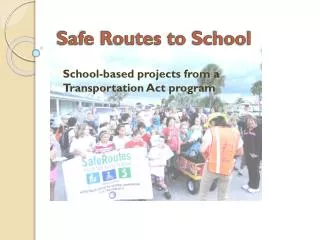
Safe and Active Routes to SchoolContributes to Safe and Healthy Communities by: • Protecting children from traffic death and injuries. • Bringing children better health. • Eliminating inefficient and unnecessary driving. • Strengthening neighborhoods.
Successful Programs IncorporateOne or More of the Following • Encouragement • Education • Engineering • Enforcement
A Successful Program Integrates • Health • Fitness • Traffic Relief • Environmental Awareness • Safety
Gathering Data • Current biking & walking rates. • Potential biking & walking rates. • Physical barriers to safe or appealing trip. • Preference or attitudinal barriers to trip. • Bicycle and pedestrian crashes & injuries.
Gathering More Data • Traffic law infractions near school. • Dangerous behavior near school. • Physical activity level of students. • Biking/walking behavior in community. • Air pollution caused by private car trips.
Measuring Bikeability and Walkability • Take the trip with a child-decide together. • Pick a route to a park, school, or friend’s. • Bring a checklist. • Bring a map. • Make a special note of problem areas. • Score the rest of your community.
Photo Connecting Cul-de-Sacs After Connecting cul-de-sacs: after School playground Connector path at the end of a cul-de-sac
Common Threads • Community values biking and walking. • Drivers are educated about their impacts. • Drivers are alerted about child bikers & walkers. • Children & parents understand safety. • Officials enforce laws. • Planners address community concerns. • Streets designed to encourage biking & walking.
Measuring Success • Behavior of children. • Behavior of drivers. • Community facilities. • Crashes and injuries. • Community buy-in. • Environmental quality.
Success Story: Marin County, CA Encouragement Programs • Walk or Wheel Wednesdays • Frequent Rider Mile Contests • Walking school buses • Fliers, posters, newsletters • Media coverage • Website
Success Stories: Wisconsin and S. Carolina Rethink Neighborhood Schools • Through Milwaukee’s Neighborhood School Initiative, city building 6 new schools adding on to 19 existing schools, and renovating 15 existing schools. • South Carolina eliminating state-mandated acreage requirements for new schools.
The school bus driver registered a complaint with the superintendent that she was driving an almost empty bus. Save the planet! It’s the only one with chocolate. Walking and talking with my dad was the best bit. We saw two slugs with no homes, but they still had their aerials, and someone had dropped their apple from their packed lunch. I wish my dad could walk with me all the time. I think the number of dogs walking with their families may have exceeded the number of children riding the bus to school this morning. I like skipping and I can skip when I walk to school. Quotes From Around the World
Actions of Washington State Legislature • Safe Routes Legislation – requires certain elementary schools to develop safe walking route map. • Transportation Funding Allocation Revision – was based on existence of hazardous walking conditions. Can now be used for busing. • Traffic Safety Near Schools – Matching grant program for capital projects. Not currently funded.
Programs in Washington • WSDOT awarded $1M in 2004. • WSDOT likely to award > $2.5M in 2005. • WSDOH awarded grants. • WTSC awarded grants. • Federal funding sources. • Foundations continue to award grants.
How WRPA Can Get Involved • Work with schools and community leaders. • Become team members. • Promote as another form of recreation. • Become involved as parents.
Special Thanks to The Pedestrian and Bicycle Information Centerfor the Use of Photographswww.pedbikeinfo.org
BAW Dave’s contact infoThe Bicycle Alliance of WashingtonDave Janisdavej@bicyclealliance.org206.784.7176www.bicyclealliance.org