Download
1 / 26
260 likes | 630 Views
Transportation and Distribution in the New York Metropolitan Area. Dr. Jean-Paul Rodrigue Dept. of Economics & Geography Hofstra University Hempstead, NY http://people.hofstra.edu/faculty/jean-paul_Rodrigue/. Outline. Basic historical considerations Transport context and profile

E N D
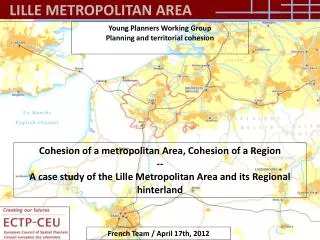
Transportation and Distribution in the New York Metropolitan Area Dr. Jean-Paul Rodrigue Dept. of Economics & Geography Hofstra University Hempstead, NY http://people.hofstra.edu/faculty/jean-paul_Rodrigue/
Outline • Basic historical considerations • Transport context and profile • Main public transport agencies • Congestion • Challenges in freight distribution
Basic Historical Considerations • Initial location • Port site. • Hinterland access (Hudson). • Canal era • Erie Canal (1825) expanded the port’s hinterland. • By 1850, the dominant seaport of the Eastern Seaboard. • Rail • Emergence as a rail hub in the late 19th century. • Industrialization. • Highway / air • Regionalization: BostWash • Globalization. Location Canals Rail Highway / air
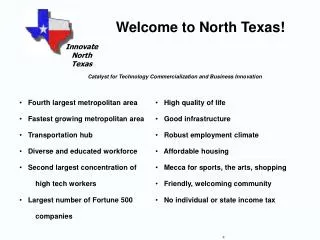
Transport in New York: Context • Transport capital: New York / New Jersey • Population of 21.2 million (7.5% of the national population). • 2nd largest passengers and air freight gateway in the world. • 3rd largest container port in the US. • Largest public transit system in North America. • The gateway function • Large international terminals (port and airports). • Serves the Eastern Seaboard. • Local economy • Significant deindustrialization. • Service oriented. • High level of consumption.
Mean Travel Time to Work for Selected American Cities (in minutes), 1980-1990
Largest Subway Systems in the World by Annual Ridership and Metropolitan Population, 2000
Main Public Transport Agencies in New York • PANYNJ (Port Authority of New York & New Jersey) • Founded in 1921 to address jurisdictional issues. • New York harbor and the lower Hudson River are the boundary between the states of New York and New Jersey. • MTA (Metropolitan Transport Authority) • Founded in 1965 to provide one comprehensive authority to manage New York’s public transport system. • Annual budget of 7.5 billion. • Handles 7.7 million passengers per day.
Congestion in New York • Factors specific to the region • Geographical factors: • Major bottlenecks: bridges over the Hudson and East River. • Manhattan; a limited access high density island. • Long Island; a “dead-end” with 6 million inhabitants. • Early suburbanization: • High density single family homes with small lots. • Prior to the development of the Interstate system and the boom in motorization. • Highways of lesser capacity or not designed to handle heavy traffic. • Little if any room for additional capacity. • Affluence and land values: • Consumption effect. • Sprawl (fixity of existing ownership).
Congestion in New York • Electronic toll system • “Congestion pricing” has been applied since the construction of trans-Hudson bridges and tunnels. • Known as “Ez-Pass”. • Implemented between 1993 and 1997. • A response to substantial delays at toll booths: • More transactions per hour. • Each vehicle has an electronic tag linked to an account. • Vehicle must slow down to 15 mph (25 km/h) at tool. • For bridges accessing NYC, tolls are collected in one direction only (inbound). • 1.5 million vehicles per day. • Implementation of fast gates (50 mph) starting from 2004.
Toll Bridges and Roads, New York Metropolitan Area (1000s of vehicles per day) Hudson River Long Island Sound GWB 300 New Jersey TNB Bronx 110 100 LT 100 Manhattan WSB Garden State Parkway TBB 125 80 100 QMT Long Island HT Queens 60 BBT 20 20 75 BYB CBB Brooklyn GTB 210 NJ Turnpike VZB 20 Staten Island MPB Lower New York Bay 75 Raritan Bay OCB
Daily Vehicle Traffic, 1998 Traffic per Day < 30,000 30,000 – 50,000 50,000 – 100,000 100,000 – 175,000 > 175,000
Volume to Capacity Ratio, 1998 VCR < 0.3 0.3 – 0.5 0.5 – 1.0 1.0 – 1.5 > 1.5
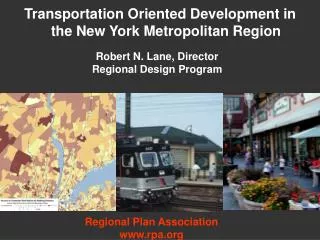
Challenges of Urban Freight Distribution • Distribution facilities • Migrating to more affordable locations in the periphery. • Growth in tons-km. • Competition between passengers (commuters) and freight traffic. • Urban supply chains • Difficulties to maintain just-in-time and timely supply. • High distribution costs. • Adaptation of modes and delivery times.
Truck Freight Corridors New York New Jersey TZB Connecticut GWB Bronx TBB TNB LT WSB Manhattan LGA Long Island HT Queens EWR GTB BYB Brooklyn JFK VZB Staten Island Major Crossing OCB About 70 million trucks crossings per year
Rail Freight Corridors and Port Facilities New York New Jersey Bronx Manhattan NJ Distribution Cluster Long Island Queens Brooklyn Staten Island Port Terminal Intermodal Terminal
Distribution of General Cargo Operations, Port of New York, 1959, 1987 and 2000
Container Traffic Handled by the Port of New York, 1991-2003
Intermodal Facilities and Navigation Channels of the Port of New York, 2003 Albers Equal-Area Conic Projection East River 40 45 Hudson River 1- Port Newark 2- Port Elizabeth 3- Global Marine 43 Newark Bay Channel 40 Red Hook 40 1 3 Upper Bay Channel South Brooklyn 2 45 Brooklyn 45 Daily Truck Movements (one way), 2001 37 Kill Van Kull Channel Howland Hook New Jersey 45 37 Arthur Kill Channel The Narrows Staten Island Navigation Channel Ambrose Channel 45 45 30 Control Depth (feet) Main Ship Channel N Intermodal Terminal 37 Arthur Kill Channel 37 Container Port (proposed) Raritan Bay Channel Major Highway Proposed rail tunnel
Freight handled at New York’s Major Airports, 1985-2002 (in short tons)
Port Inland Distribution Network Albany Syracuse Boston Hartford / Springfield Worcester / Framingham Davisville New Haven Bridgeport Potential Regional Barge Port New York Reading LO/LO Barge Service Philadelphia Inland Rail Terminal New York Metropolitan Area Wilmington Inland Rail Route Hanover Camden Volume to Capacity LOS Salem Potential Freight Catchment Area 0 – 0.30 (A) 0.31 – 0.50 (B) 0.51 – 0.71 (C) 0.72 – 0.89 (D) 0.90 – 1.15 (E) > 1.15 (F) Baltimore Freight Cluster Washington