Download
1 / 5

E N D
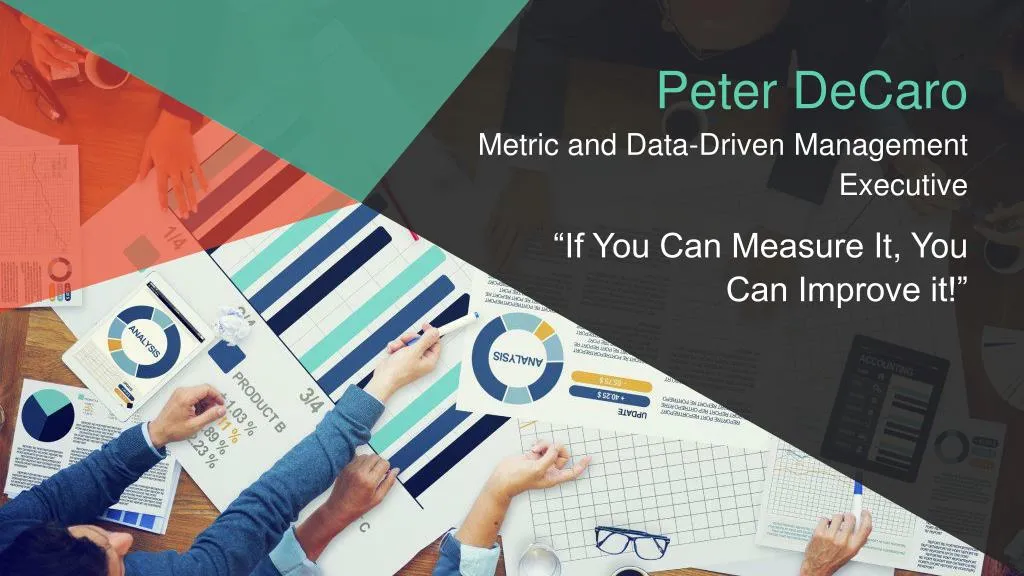
Peter DeCaro Metric and Data-Driven Management Executive “If You Can Measure It, You Can Improve it!”
Customer Support and Service • Integrated NPS (Net Promoter Score), QA monitoring and Trustpilot™ to improve client retention and balance client touchpoints. • Provided clients with ongoing feedback and engagement. Identified deficient customer support and product shortcomings that required attention. • Recognized in 2015, Crain’s New York’s Business 50 “Fastest Growing Companies” – Also utilized same approach from 2005–2015 to improve retention rates by as much as 55% upon implementation to an industry-leading 10% in current role.
Customer Support and Service • Created Excel-based “Quick Doc” Tool in order for agents to quickly identify and resolve client concerns. • Generates log notes for recaps and provides advanced “branching” ability so Agents can determine root cause and improve ability to deliver “one call resolution”. Improve log not accuracy for better client experience and retention. Customer Service – QUICK DOC TOOL – Version M9
KPIs Designed to Track and Improve Employee Performance • Created Employee Dashboards which display real time KPIS to both Managers and Agents. Comparative analysis (including; variance, QA, average handle time, CPH. DND/Wrap etc ), Building blocks for “Best in Class” improvement strategies, staffing plans and reward program. Allows for the ability to scale with quantifiable metrics. • Designed “Performance Rewards Program” which recognizes the top performers across key performance and productivity metrics. • Produced Monthly KPI reports to senior leadership which analyzed call and workflow trends, as well as upsell, winback, churn/retention, P&L, productivity and customer wellness.
P&L/Churn • A regular component of all positions I’ve heard is the ongoing monitoring of P&L. In my current role, P&L is monitored across seven accounts. • Typically most analysis is centered on scheduled vs. recognized revenue, cost considerations, refund/chargeback/makegood and related subscription analytics. I’ve also produced extensive analysis on churn (typically by cohort) in order to determine potential product concerns and define better retention strategies.