Download
1 / 50
510 likes | 635 Views
A guide to good graphics . Data Presentation. Bureau of Justice Statistics October 11, 2000. Marianne W. Zawitz zawitzm@ojp.usdoj.gov. Quality presentations of data -. Bureau of Justice Statistics. Take advantage of how we already process information

E N D
A guide to good graphics Data Presentation Bureau of Justice Statistics October 11, 2000 Marianne W. Zawitz zawitzm@ojp.usdoj.gov
Quality presentations of data - Bureau of Justice Statistics • Take advantage of how we already process information • Reduce the number of processes required to understand the data • Tear down some fundamental obstacles to understanding
Statistical Graphics -- • show the big picture • are paragraphs of data • are best when constructed to convey one finding or concept Bureau of Justice Statistics
The purpose is to show the data. Bureau of Justice Statistics Therefore, you should maximize: • Data density • Data ink
Example of a graphic with high data density Bureau of Justice Statistics
Use graphics, when you have - • More than 10 data points • To show big picture not fine data Bureau of Justice Statistics Use tables, when you need - • Exact numeric values • Localized comparisons
Graphics for continuous variables Bureau of Justice Statistics • Line graphs • Area charts • Scatter plots • Maps
Line chart Age of offender 18 years old Bureau of Justice Statistics 17 19 16 20 15 13-14
Area chart Bureau of Justice Statistics
Scatter plot Bureau of Justice Statistics
Map - with scaled values Bureau of Justice Statistics
Graphics for categorical variables Bureau of Justice Statistics • Bar graphs • Maps • Diagrams
Bar graph Criminal history of detained Vs. released felony defendants, 1990 Bureau of Justice Statistics Prior criminal history Released Arrest Detained Any conviction Felony conviction Violent felony conviction
Map - categorical data Oldest age for juvenile court jurisdiction Bureau of Justice Statistics 15 years old 16 17
Diagram Manhattan, New York Bureau of Justice Statistics 40 dismissed 2 rejected 3 to trial 100 drugarrests 98 accepted 55 guilty plea Washington, D.C. 16 rejected 30 dismissed 5 to trial 100 drugarrests 84 accepted 49 guilty plea
Cleveland’s Hierarchy of graphical perception • Position along a common scale • Position along identical nonaligned scales • Length • Angle - Slope • Area • Volume • Color - Hue Bureau of Justice Statistics
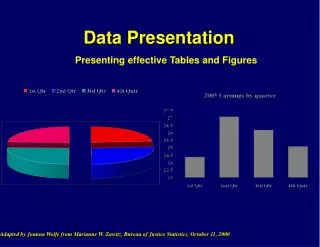
Graphic styles to avoid • Pie charts • Stacked bar graphs • Stacked line graphs Bureau of Justice Statistics
A 21 B 19 C 18 D 14 E 12 F 9 G 7 Bureau of Justice Statistics
"Simplicity of design and complexity of data" Edward R. Tufte Bureau of Justice Statistics
The purpose of a chart is to show the data, so you need to avoid - • Nondata ink • Chartjunk Bureau of Justice Statistics
Nondata ink • Grids • Ticks • Frames • Anything that does not convey data Bureau of Justice Statistics
Example of chart junk Bureau of Justice Statistics
Avoid optical illusions • Broken lines, markers, and hatching fill patterns obscure the data and are hard to look at • Improper aspect ratios can distort the slope of a line • Perspective can distort values Bureau of Justice Statistics
Use solid lines and avoid markers on lines • Patterned lines can mislead the user • Broken lines and markers require the brain to consolidate all of the pieces (continuation effect) Bureau of Justice Statistics
Age of offender 18 years old 17 16 15 13-14 Bureau of Justice Statistics
Age of offender 18 years old 17 16 15 13-14 Bureau of Justice Statistics
Age of offender 18 years old 17 16 15 13-14 Bureau of Justice Statistics
Use solid fill patterns • Hatched fill patterns cause a moiré effect which is hard to look at • Keep the space between bars to a minimum to avoid the moiré effect Bureau of Justice Statistics
Example of cross hatching problems Bureau of Justice Statistics
Criminal history of detained Vs. released felony defendants, 1990 Bureau of Justice Statistics Prior criminal history Arrest Any conviction Felony conviction Violent felony conviction
Criminal history of detained Vs. released felony defendants, 1990 Prior criminal history Released Arrest Detained Any conviction Felony conviction Violent felony conviction Bureau of Justice Statistics
Use an aspect ratio that is appropriate to the data and our visual system • The aspect ratio of a chart is the comparison of the width to the height • An improper aspect ratio can distort the slope of a line or make differences disappear Bureau of Justice Statistics
The proper aspect ratio of a chart is about 1 tall to 1.3 wide 1 1.3
Never use 3 dimensional designs for 2 dimensional data • Designs done in perspective make accurate comparisons impossible • Data can easily be hidden Bureau of Justice Statistics
Hidden data is a common problem with 3D presentations of 2D data Bureau of Justice Statistics
A simple line chart in 2 dimensions avoids hiding data South West Midwest Northeast Bureau of Justice Statistics
Avoid graphical puzzles • Start the scale at zero • Use only one unit of measurement per graphic Bureau of Justice Statistics
How to lie with statistics Bureau of Justice Statistics
Not a lie, but a puzzle Bureau of Justice Statistics
Understandable truth U.S. Homicide Rate and Percent of Population 18-24 Bureau of Justice Statistics
Scale selections should -- • include all of the data • result in ticks, grids, or labels that are easy to understand like 10s, 100s, 1,000s • use as few labels as required to convey the message Bureau of Justice Statistics
How to display many lines on a line chart • Use small multiples • Use different colors for different lines • Use different weights or shades in black and white • Break lines to show one on top • Reduce the number of lines shown to those of interest Bureau of Justice Statistics
Small multiples Weapons arrest rate, 1965-92 16 years old 18 years old Bureau of Justice Statistics 17 years old 19 years old
Make all verbal tasks easy to understand • Do not use abbreviations • Avoid acronyms • Write all labels left to right • Use proper grammar • Do not use legends unless using maps Bureau of Justice Statistics
Difficult verbal tasks Criminal history of detained Vs. released felony defendants, 1990 Bureau of Justice Statistics
Easy to perform verbal tasks Criminal history of detained Vs. released felony defendants, 1990 Prior criminal history Released Arrest Detained Any conviction Felony conviction Violent felony conviction Bureau of Justice Statistics