Download

1 / 24
240 likes | 674 Views
Count Data Models in SAS. Introduction. A comprehensive survey of models for count data in SAS Why? Gaining popularity since 1980 => Insurance: # of auto/medical insurance claims => Banking: # of delinquencies / missed payments => Marketing: # of responses / purchases

E N D
Count Data Models in SAS © 2006 ChoicePoint Asset Company. All Rights Reserved.
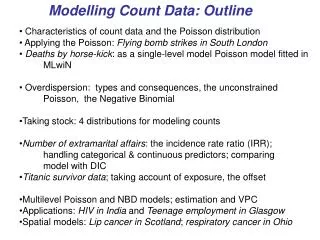
Introduction • A comprehensive survey of models for count data in SAS • Why? Gaining popularity since 1980 => Insurance: # of auto/medical insurance claims => Banking: # of delinquencies / missed payments => Marketing: # of responses / purchases • 5 Models to be covered: poisson regression, negative binomial regression, hurdle poisson regression, zero-inflated poisson regression, finite mixture (latent class) poisson regression © 2006 ChoicePoint Asset Company. All Rights Reserved.
SAS Capability © 2006 ChoicePoint Asset Company. All Rights Reserved.
Count Data • Nature of count data nonnegative, discrete, skewed distribution high proportion of zero outcomes potential problems: over-dispersion (variance >> mean) , excess zeroes • Why OLS won’t work? counts are heteroskedastic (variance dependent on mean) predicted has to be nonnegative (log transformation won’t work) • A case study: model # of hospital stays © 2006 ChoicePoint Asset Company. All Rights Reserved.
Data Summary Classical data for count models: - 4406 elderly respondents sampled from National Medical Expenditure Survey (NMES) in 1987 - Information included: 7 health, demo, and socio-econ variables © 2006 ChoicePoint Asset Company. All Rights Reserved.
Starting Point © 2006 ChoicePoint Asset Company. All Rights Reserved.
Baseline Model • Probability Function of Poisson Regression proc nlmixed data = data; params b0 = 0 b1 = 0 b2 = 0 ... ...; mu = exp(b0 + b1 * x1 + b2 * x2...); p = exp(-mu) * mu ** y / fact(y); ll = log(p); model y ~ general(ll); Run; Identical to Prob. Function © 2006 ChoicePoint Asset Company. All Rights Reserved.
Result of Poisson Model © 2006 ChoicePoint Asset Company. All Rights Reserved.
Test for Over-Dispersion • Auxiliary OLS regression (Cameron, 1996): data ols_tmp; set poi_out; dep = ((y - yhat) ** 2 - y) / yhat; run; proc reg data = ols_tmp; model dep = yhat / noint; run; significant yhat indicates over-dispersion © 2006 ChoicePoint Asset Company. All Rights Reserved.
Alternative I • Most common alternative: Negative Binomial Regression • NB can be considered a generalized Poisson by including a dispersion parameter. © 2006 ChoicePoint Asset Company. All Rights Reserved.
Alternative I • Probability Function of Negative Binomial Regression proc nlmixed data = data; params b0 = 0 b1 = 0 b2 = 0 ... ...; mu = exp(b0 + b1 * x1 + b2 * x2 ... ...); p = gamma(y + 1/alpha) / (gamma(y + 1) * gamma(1/alpha)) * ((1/alpha) / (1/alpha + mu)) ** (1/alpha) * (mu / (1/alpha + mu)) ** y; ll = log(p); model y ~ general(ll); Run; © 2006 ChoicePoint Asset Company. All Rights Reserved.
Result of NB Model © 2006 ChoicePoint Asset Company. All Rights Reserved.
Alternative II • Hurdle Regression (Mullahy, 1986) Two Parts: - zero outcomes: Logistic regression - positive outcomes: Truncated Poisson regression • Probability Function of Hurdle Regression © 2006 ChoicePoint Asset Company. All Rights Reserved.
Alternative II proc nlmixed data = data; params b0 = 0 b1 = 0 ... a0 = 0 a1 = 0 ...; xb = b0 + b1 * x1 + b2 * x2 ... ...); mu = exp(b0 + b1 * x1 + b2 * x2...); xa = a0 + a1 * x1 + a2 * x2 ... ...); if y = 0 then p = exp(xa) / (1 + exp(xa)); else p = (1 - exp(xa) / (1 + exp(xa))) / (1 - exp(-mu)) * (exp(-mu) * mu ** y / fact(y)); ll = log(p); model y ~ general(ll); Run; Prob function for zeroes Prob function for positive © 2006 ChoicePoint Asset Company. All Rights Reserved.
Result of Hurdle Model © 2006 ChoicePoint Asset Company. All Rights Reserved.
Alternative III • Zero-inflated Poisson Regression (Lambert, 1992) Two sources of zeroes - a point mass of zeroes - zeroes from standard Poisson distribution • Probability Function of Hurdle Regression © 2006 ChoicePoint Asset Company. All Rights Reserved.
Alternative III proc nlmixed data = data; params b0 = 0 b1 = 0 ... a0 = 0 a1 = 0 ...; xb = b0 + b1 * x1 + b2 * x2 ... ...); mu = exp(b0 + b1 * x1 + b2 * x2...); xa = a0 + a1 * x1 + a2 * x2 ... ...); if y = 0 then p = exp(xa) / (1 + exp(xa)) + (1 - exp(xa) / (1 + exp(xa)) * exp(-mu); else p = (1 - exp(xa) / (1 + exp(xa))) * (exp(-mu) * mu ** y / fact(y)); ll = log(p); model y ~ general(ll); Run; Prob function for zeroes Prob function for zeroes © 2006 ChoicePoint Asset Company. All Rights Reserved.
Result of ZIP Model © 2006 ChoicePoint Asset Company. All Rights Reserved.
Alternative IV • Latent Class Poisson Regression (Wedel, 1993): - Existence of S >= 2 classes of latent segments in the data - Each latent segment is poisson with different parameter - Each case drawn from such latent segments with certain probs. - Interesting in marketing: segment and model at the same time • Probability Function of LC Poisson Regression © 2006 ChoicePoint Asset Company. All Rights Reserved.
Alternative IV proc nlmixed data = data; params a0 = 0 ... b0 = 1 ... c0 = 2 ... prior1 = 0 to 1 by 0.1 prior2 = 0 to 1 by 0.1; xa = a0 + a1 * x1 + a2 * x2 ... ...); ma = exp(xa); pa = exp(-ma) * ma ** y / fact(y); xb = b0 + b1 * x1 + b2 * x2 ... ...); mb = exp(xb); pb = exp(-mb) * mb ** y / fact(y); xc = c0 + c1 * x1 + c2 * x2 ... ...); mc = exp(xc); pc = exp(-mc) * mc ** y / fact(y); p = prior1 * pa + prior2 * pb + (1 - prior1 - prior2) * pc; ll = log(p); ... ... © 2006 ChoicePoint Asset Company. All Rights Reserved.
Result of LC Poisson © 2006 ChoicePoint Asset Company. All Rights Reserved.
Models Prediction 1) Poisson cannot give adequate fit for the data. 2) Hurdle and ZIP are better to model excess zeroes. 3) NB and LC are better to handle heterogeneity. © 2006 ChoicePoint Asset Company. All Rights Reserved.
Models Comparison 1) AIC & BIC is convenient and easy to compute for model comparison, good enough for practitioners. BIC tends to select a more parsimonious model. 2) Vuong test is good but computationally tedious (code available in the paper), recommended for researchers. © 2006 ChoicePoint Asset Company. All Rights Reserved.
Conclusion • In practice, Poisson model usually is not sufficient for over-dispersed data but useful as a baseline model. (Rule of Thumb for Over-Dispersion: Variance ≥ 2 * Mean) • It is important to identify the reason for over-dispersion, long tail, excess zeroes, or … … ? (Excess zeroes might be the most common reason) • Statistics shouldn’t be the only consideration for model selection. Examples: 1) Both Hurdle and ZIP suggest positive effect of private insurance on hospital stays, which makes perfect sense. 2) LC provides a possibility to segment population, which is invaluable in marketing, insurance, and credit risk. © 2006 ChoicePoint Asset Company. All Rights Reserved.