Download
1 / 21
210 likes | 334 Views
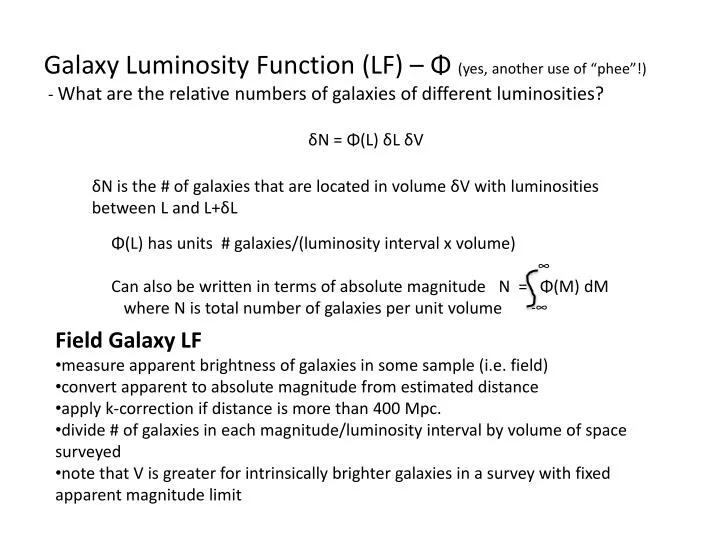
Galaxy Luminosity Function (LF) – Φ (yes, another use of “ phee ”!) - What are the relative numbers of galaxies of different luminosities?. δN = Φ(L) δL δV. δN is the # of galaxies that are located in volume δV with luminosities between L and L+δL.

E N D
Galaxy Luminosity Function (LF) – Φ(yes, another use of “phee”!) - What are the relative numbers of galaxies of different luminosities? δN = Φ(L) δL δV δN is the # of galaxies that are located in volume δV with luminosities between L and L+δL Φ(L) has units # galaxies/(luminosity interval x volume) Can also be written in terms of absolute magnitude N = Φ(M) dM where N is total number of galaxies per unit volume • Field Galaxy LF • measure apparent brightness of galaxies in some sample (i.e. field) • convert apparent to absolute magnitude from estimated distance • apply k-correction if distance is more than 400 Mpc. • divide # of galaxies in each magnitude/luminosity interval by volume of space surveyed • note that V is greater for intrinsically brighter galaxies in a survey with fixed apparent magnitude limit ∞ -∞
Problems: • Malmquist Bias in magnitude limited surveys • Distance estimate uncertainties • enhancements (clusters/walls) and voids in galaxy distribution (for a given magnitude, N can depend on spatial distribution as much as Φ) • Field LF reveals • 1) # density of galaxies declines w/increasing L • 2) decline increases sharply at some characteristic luminosity L* α • Schechter (1976) found LF well described by • Φ(L) = Φ*/L* (L/L*)α exp(-L/L*) • this is the SLF Φ* = 5.5 x 10⁻³ galaxies/Mpc3 L* = 2 x 10¹⁰Lsun M*B = -20.4 α = -1.07±0.07 (Efstathiou, Ellis, & Peterson 1988)
In optical bands (from SDSS: Montero-Dorta & Prada 2008) Move to K-band (IR) to avoid domination of light by star forming regions and sample more “typical” stars (Gardner at al. 1997) Φ* = 5.5 x 10⁻³ galaxies/Mpc3 L* = 2 x 10¹⁰Lsun M*K = -23.8 α = -0.9 ± 0.2 2MASS (Kochanek et al. 2001) Φ* = 4.1 x 10⁻³ galaxies/Mpc3 L* = 2 x 10¹⁰Lsun M*K = -23.4 α = -1.09 ± 0.06 Even though different wavelengths are dominated by different stellar types, LFs are virtually the same in optical and infrared.
Remarks about SLF • works for all galaxies lumped together; individual galaxy types not as well fit • Milky Way and Andromeda are close to or just fainter than L* • galaxies with L ≥ 3L* are very rare • SLF predicts too many galaxies at low L (as L 0, N ∞) Calculate total # of galaxies in some volume whose luminosity exceeds L N(>L) = Φ(L’) dL’ = Φ* xαe-xdx = Φ* Γ(1+α) (recall Γ(z) = tz-1 e-tdt) for α ≤ -1, as L 0, N(>L) ∞ Thus, SLF fails at low L with α ≤ -1 ∞ ∞ ∞ ∞ Calculate total luminosity of galaxies Ltot = Φ(L) L dL = Φ* L* xα+1 e-xdx Ltot = Φ* L* Γ(2+α) ≈ Φ* L* with α = -1 So, Ltot is finite for α = -1 even though Ntot goes to infinity... phew! L’=L x=L/L* x=0 0
Cluster Galaxy LF • easier to obtain since all galaxies are at the same distance and together in the sky • difficult since rich clusters are rare and typically at greater distances • Cluster LFs are reasonably well fit with SLF and thus are similar to the field. • Main differences: • α is steeper (α ≈ -1.3) • Φ* is larger due to increased density in clusters compared to field • excess of bright galaxies (e.g. cD galaxies do not fit well into SLF)
LF divided by Morphological Type -early and late type galaxies separate in LF -somewhat similar but note differences From Las Campanas Redshift Survey with SLF fit to all galaxies M*R = -21.1 α = -0.7 ± 0.05
LF divided by Morphological Type -early and late type galaxies separate in LF -somewhat similar but note differences (from SDSS: Montero-Dorta & Prada 2008)
Jerjen & Tammann (1997) decomposed LF into morphological classes (B-band values) • Spirals – Gaussian shape with <M> = -17.6, σ = 1.4 mag • S0’s – Gaussian shape with <M> = -18.3, σ = 1.1 mag • E’s – Gaussian skewed to bright end with <M> = -17.7 • Irr – SLF with M* = -15.8, α = -0.3 • dE – SLF with M* = -16.7, α = -1.3 High L cut-off occurs at same place for field and clusters because of characteristic M* for Sp’s and E’s and their similarity Steeper slope for clusters comes from increased population of dE’s
Galaxy Groups • More poorly clustered and containing fewer members than clusters • Contain mostly disk systems – spirals and Irr • e.g. Ursa Major group – of brightest 79 galaxies, only 2 are E’s • Random velocities of galaxies are slower than cluster members • σ = 700 – 1200 km/s for cluster galaxies • σ = 100 – 500 km/s for group galaxies • Thus, group galaxies affect each other more than do cluster galaxies – gravity has time to pull at gas and stars • Stephan’s Quintet • rare compact group • 109 Msun hot gas (Tx~107K) • 1010Msun cool gas • gas primarily intergalactic (galaxies are mostly stripped of gas) • gas heated to high temperatures due to collisions
The Local Group • about 35 – 40 galaxies within ~1.5 Mpc of MW • brightest member – Andromeda (M31) • other spirals – MW and M33 • No bright ellipticals • More than half are dE’s and dSph’s • Rest are irregulars (Magellanic Clouds) • Probably missing some objects near the galactic plane • e.g. Sagittarius dwarf just discovered in 1994 (Ibata, Gilmore & Irwin 1995) • More than 90% of Local Group galaxies have Mv fainter than -18 (3 x 10⁹Lsun) Milky Way, Andromeda and M33 emit 90% of visible light from the Local Group! MW & Andromeda moving toward each other at 120 km/s Sb, Sbc, Sc Irr/dIrr dSph dE
Galaxy Collisions and Mergers In groups, galaxy collisions and mergers can be important Galaxy with mass M moves with velocity V past star of mass m in another galaxy M/m ~ 108 - 1011 Galaxy M acquires motion perpendicular to path Applies if galaxy M is small enough that its core radius rc << b. Also must have rapid flyby so that M and m do not move toward one another (when M=m, rs is the strong encounter radius discussed before) Star m must gain an equal and opposite momentum, so the total kinetic energy in perpendicular motions is Note that the object of smaller mass acquires most of the energy provided from forward motion of M, which consequently changes as the velocity of M changes (ΔV para). Equating kinetic energy before with after If ΔV para << V, we can drop higher order terms to find that galaxy M slows by
Since the KE transferred to m grows as M2, a larger galaxy is braked more quickly • The faster M flies by (larger V), the less time it has to transfer energy to m and the less speed it looses. • What is the deceleration of galaxy M due to it passing through a region of a 2nd galaxy with n stars and density m/pc3? Integrate over all stars to find the average rate at which it slows: • -deceleration due to dynamical friction (brakes motion relative to background stars) • Λ=bmax/bmin = bmaxV2/GM • -Slower M moves, larger its deceleration • -For small satellite moving in galaxy’s dark halo, orbit decays and it spirals inward. Friction force depends on mass density nm, not mass alone. • -A massive satellite will slow more quickly than a small one • LMC will likely merge with MW in several Gyr but most of MW’s globular clusters (105 times lighter) will not. bmax = distance where density of stars is much less than in M bmin = strong encounter radius as before
Application of Dynamical Friction Formula Considering a field velocity distribution with dispersion σ, dynamical friction equation can be written where X = V/ σ √2 from Mark Whittle’s website @ UVa
When two galaxies pass by each other, energy taken from their forward motion is transferred to random motions of stars. • Spiral or S0 thickens disk • After the interaction, the total KE (rotational and random) will be lower than before the collision – why? • If they pass more slowly (like in a group), at speeds not much more than stellar motions within the galaxies • disrupts disk motion • stars and gas can be pushed out to large radii • if enough energy is drained, they will merge • collision of gas-rich galaxies may cause a starburst If they pass at high V (like in rich cluster) will probably not become bound, but could cause formation of bar or initiate spiral structure (e.g M81 2-armed spiral likely caused by flyby of close companions – though this example in a group).
NGC 4676 (the Mice) • R-band with HI overlay showing gas in tidal tails (this material will not fall back into galaxy for several Gyr) • results of simulation with two disks merged • velocity of stars in simulations compared with gas velocity
Videos illustrating dynamical interactions of equal-mass disk galaxies (Barnes 1992) 1. Before their collision, two disk galaxies are rotated about their vertical axis. Each galaxy contains a thin disk (blue), a central bulge (yellow), and a dark halo (red). One disk lies in the orbit plane, and spins in the same direction that the galaxies circle each other. The other disk is inclined by an angle of 71 degrees. 2. The galaxies approach each other, tidally interact as they pass each other, and fling out tidal bridges and tails. Subsequently they reach maximum separation, fall back together, and merge. The counter in the upper right shows time in units of 250 million years. 3. Just after the merger, the remnant is rotated about the vertical axis to illustrate the shells, plumes, and tails typical of very young merger remnants. Josh Barnes - IfA
Encounter and merger of two disk galaxies with a 3:1 mass ratio. The galaxies orbit each other in a clockwise direction, and the orbit plane is viewed face-on. The larger disk lies in the orbit plane but spins in a counter-clockwise direction, while the smaller disk is inclined at an angle of 71 degrees. Each frame shows the dark matter in red, the disk stars in blue, and the bulge stars in yellow. The nominal time-span between frames is 250 million years, or roughly one galactic rotation period. The main result is that disk galaxies can sometimes accrete smaller (1/3-mass) companions without being totally disrupted, in contrast to the outcome of equal-mass mergers. Here the large disk survives because it does not couple strongly to a retrograde perturber. (Barnes et al 1995)