Download
1 / 54
550 likes | 714 Views
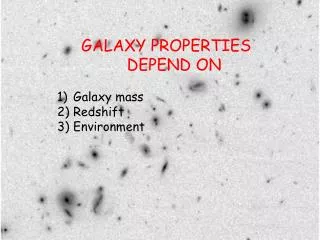
How to kill a galaxy (A review of galaxy properties as a function of environment). Michael Balogh. University of Waterloo, Canada (Look for new job postings on AAS). John Mulchaey & Gus Oemler OCIW. Collaborators. Richard Bower , Simon Morris, Dave Wilman

E N D
How to kill a galaxy(A review of galaxy properties as a function of environment) Michael Balogh University of Waterloo, Canada (Look for new job postings on AAS)
John Mulchaey & Gus Oemler OCIW Collaborators Richard Bower , Simon Morris, Dave Wilman No picture: Vince Eke, Cedric Lacey, Fumiaki Nakata Durham Bob Nichol, Chris Miller & Alex Gray Carnegie Mellon Baugh, Cole, Frenk (Durham) Ivan Baldry & Karl Glazebrook Johns Hopkins Ray Carlberg Toronto Ian Lewis (Oxford) and the 2dFGRS team No picture: Taddy Kodama
Outline • Background and motivation • Low redshift: SDSS and 2dFGRS • Groups and clusters at z~0.5 • GALFORM predictions • Conclusions
Outline • Background and motivation • Low redshift: SDSS and 2dFGRS • 3. Groups and clusters at z~0.5 • 4. GALFORM predictions • 5. Conclusions
Why Does Star Formation Stop? B) External? Hierarchical build-up of structure inhibits star formation A) Internal? i.e. gas consumption and “normal” aging (Hopkins et al 2004)
Galaxy clusters: the end of star formation? • “Dead” galaxies (i.e. little gas or star formation) found in rich clusters • Hierarchical formation models predict number of clusters increases with time. • So perhaps dense environments are responsible for terminating star formation?
Nature or Nurture? • Nature? Elliptical galaxies only form in protoclusters at high redshift. Rest of population is due to infall. • or Nurture? Galaxy evolution proceeds along a different path within dense environments. • If this is true in groups and clusters, then environment could be the driving force of recent galaxy evolution…
van Dokkum & Franx 1996: M/L evolution consistent with high formation redshift Early type galaxies Tight colour-magnitude relation (Faber 1973; Visvanathan & Sandage 1977; Terlevich et al. 2001) Bower, Lucey & Ellis 1992
Morphology-Density Relation E S0 Clusters Spirals Field Dressler 1980
Morphology-density: evolution Low redshift NS0/NE Number of galaxies Z~0.5 Redshift Dressler et al. 1997; Couch et al. 1994; 1998 Fasano et al. 2000 Wide field HST: Treu et al. 2003 Log surface density
HI deficiency Mark I and II imaging of Virgo galaxies Davies & Lewis 1973 VLA imaging of Coma spirals Bravo-Alfaro et al. 2000 18 nearby clusters: Solanes et al. 2001
Star formation • Fraction of emission-line galaxies depends strongly on environment, on all scales • Trend holds in groups, field, cluster outskirts (Lewis et al. 2002; Gomez et al. 2003) • Fraction never reaches 100%, even at lowest densities Cluster infall regions Emission line fraction in SDSS and 2dFGRS (Balogh et al. 2004) A901/902 supercluster (Gray et al. 2004) correlation with dark matter density
Emission lines • Cluster galaxies of given morphological type show less nebular emission than field galaxies • suggests star formation is suppressed in cluster galaxies Emission line fraction Dressler, Thompson & Shectman 1985; Also Gisler 1978
Ha distribution Virgo spirals • Cluster galaxies often show peculiar distribution of Ha emission: usually truncated, or globally suppressed • In some cases, star formation is centrally enhanced (Moss & Whittle 1993; 2000) Ha for Virgo galaxy Ha for normal galaxy Koopmann & Kenney 2004 also: Vogt et al. 2004
Additional physics? • Ram-pressure stripping (Gunn & Gott 1972) • Collisions / harassment(Moore et al. 1995) • “Strangulation”(Larson et al. 1980; Balogh et al. 2000)
Additional physics? • Ram-pressure stripping(Gunn & Gott 1972) • Collisions / harassment(Moore et al. 1995) • “Strangulation”(Larson et al. 1980; Balogh et al. 2000) short timescale Quilis, Moore & Bower 2000 Kenney et al. 2003
Additional physics? • Ram-pressure stripping(Gunn & Gott 1972) • Collisions / harassment(Moore et al. 1995) • “Strangulation”(Larson et al. 1980; Balogh et al. 2000) important in groups? Also tidal effects from LSS? (Gnedin 2003)
Additional physics? • Ram-pressure stripping(Gunn & Gott 1972) • Collisions / harassment(Moore et al. 1995) • “Strangulation”(Larson et al. 1980; Balogh et al. 2000) • Either through tidal disruption, or shock-heating to level at which it can’t cool (e.g. Springel & Hernquist 2001) long timescale
Additional physics? • Ram-pressure stripping(Gunn & Gott 1972) • Collisions / harassment(Moore et al. 1995) • “Strangulation”(Larson et al. 1980; Balogh et al. 2000) • Either through tidal disruption, or shock-heating to level at which it can’t cool (e.g. Springel & Hernquist 2001) long timescale
S to S0 transformation? Kenney et al. 2003 Vollmer et al. 2004 • Ram pressure stripping of the disk could transform a spiral into a S0 (Gunn & Gott 1972; Solanes & Salvador-Solé 2001) • Strangulation may lead to anemic or passive spiral galaxies (Shiyoa et al. 2002) Non-SF spiral galaxies from SDSS (Goto et al. 2003) First noted by Poggianti et al. (1999) in z~0.5 clusters
S to S0 transformation? • But bulges of S0 galaxies larger than those of spirals (Dressler 1980; Christlein & Zabludoff 2004) • Requires S0 formation preferentially from spirals with large bulges (Larson, Tinsley & Caldwell 1980) perhaps due to extended merger history in dense regions (Balogh et al. 2002) Bulge size Dressler 1980
Arguments against ram pressure stripping: 1. S0 galaxies found far from the cluster core • Galaxies well beyond Rvirial may have already been through cluster core (e.g. Balogh et al. 2000; Mamon et al. 2004; Gill et al. 2004) 2. Morphology-density relation holds equally well for irregular clusters, centrally-concentrated clusters, and groups - but may be able to induce bursts strong enough to consume the gas Gill et al. 2004 Groups (Postman & Geller 1984) Spiral fraction Local galaxy density (3d)
Observations: z~0.3 • Strangulation model: • infall rate + assumed decay rate of star formation => radial gradient in SFR • Radial gradients in CNOC clusters suggest t ~2 Gyr Balogh, Navarro & Morris (2000)
Outline • Background and motivation • Low redshift: SDSS and 2dFGRS • Groups and clusters at z~0.5 • GALFORM predictions • Conclusions
Colour-magnitude relation CMR for spiral galaxies also observed (e.g. Chester & Roberts 1964; Visvanathan 1981; Tully, Mould & Aaronson 1982) SDSS allows full distribution to be quantified with high precision ( Baldry et al. 2003; Hogg et al. 2003; Blanton et al. 2003) Sloan DSS data
Analysis of colours in SDSS data: • Colour distribution in 0.5 mag bins can be fit with two Gaussians • Mean and dispersion of each distribution depends strongly on luminosity • Dispersion includes variation in dust, metallicity, SF history, and photometric errors • Bimodality exists out to z~1 (Bell et al. 2004) Bright Faint (u-r) Baldry et al. 2003
24346 galaxies from SDSS DR1. magnitude limited with z<0.08 • density estimates based on Mr<-20 Balogh et al. 2004
Fraction of red galaxies depends strongly on density. This is the primary influence of environment on the colour distribution. • Mean colours depend weakly on environment: transitions between two populations must be rapid (or rare at the present day)
How rapid must the bluered transition be? • colour evolves rapidly if timescale for star formation to stop is short • if transformations occur uniformly in time: • need t<0.5 Gyr • if transformations are more common in the past, longer timescales permitted Red Peak Blue Peak
Ha distribution • Ha distribution shows a bimodality: mean/median of whole distribution can be misleading Balogh et al. 2004
The star-forming population • Amongst the star-forming population, there is no trend in Ha distribution with density • Hard to explain with simple, slow-decay models (e.g. Balogh et al. 2000)
Isolated Galaxies • Selection of isolated galaxies: • non-group members, with low densities on 1 and 5.5 Mpc scales • ~30% of isolated galaxies show negligible SF • environment must not be only driver of evolution. All galaxies Bright galaxies
Summary: SDSS & 2dFGRS • SFH depends on environment and galaxy luminosity (mass) in a separable way. • Colour and Ha distributions suggest any transformations must have a short timescale, or have occurred preferentially in the past • but how do you reconcile this with large fraction of Virgo spirals with unusual Ha distributions? hmmm…
Outline • Background • Low redshift: SDSS and 2dFGRS • Groups and clusters at z~0.5 • GALFORM predictions • Conclusions
Evolution in clusters and groups • Results from low redshift surveys suggests we focus on two separate effects: • Evolution in the fraction of active galaxies • Evolution in the SFR distribution of those active galaxies Orientation: if environment drives evolution, expect to see weaker evolution in clusters and groups than in isolated galaxies…
Butcher-Oemler Effect • Concentrated clusters at high redshift may have more blue galaxies than concentrated clusters at low redshift • But blue fraction depends strongly on luminosity and radius so care needs to be taken to evaluate blue fraction at same luminosity limit, and within same (appropriate) radius. Andreon, Lobo & Iovino 2004 Blue fraction Blue fraction Margoniner et al. 2001 Redshift
Evolution of the red sequence • “Butcher-Oemler effect” also seen in the general field Red galaxy fraction High density All galaxies Low density MV < -20 Redshift (Bell et al 2004)
Nakata et al., MNRAS, submitted Field Postman, Lubin & Oke 2001 van Dokkum et al. 2000 2dF Fisher et al. 1998 Czoske et al. 2001 Clusters Cluster SFR evolution • Based on sparsely-sampled [OII] spectroscopy • Suggests fraction of star-forming galaxies evolves only weakly in clusters • Different from colour evolution?
Cluster SFR evolution z~0.3 z~0.5 Field Field Tresse et al. 2002 Couch et al. 2001 Balogh et al. 2002 Fujita et al. 2003 Complete Ha studies: Even at z=0.5, total SFR in clusters lower than in surrounding field Kodama et al. 2004
Cluster SFR evolution • Complete Ha based SFR estimates • Evolution in total SFR per cluster not well constrained • considerable scatter of unknown origin • systematic uncertainties in mass estimates make scaling uncertain Finn et al. 2003 Finn et al. 2003 Kodama et al. 2004
Cluster SFR evolution • Complete Ha based SFR estimates • Evolution in total SFR per cluster not well constrained • considerable scatter of unknown origin • systematic uncertainties in mass estimates make scaling uncertain Finn et al. 2003 Kodama et al. 2004 Finn et al. in prep
Evolution in groups z~0.05: 2dFGRS (Eke et al. 2004) • Based on friends-of-friends linking algorithm • calibrated with simulations. Reproduces mean characteristics (e.g. velocity dispersion) of parent dark matter haloes z~0.45: CNOC2 (Carlberg et al. 2001) • selected from redshift survey, 0.3<z<0.55 • Cycle 12 HST imaging + deeper spectroscopy with LDSS2-Magellan
Group comparison • Use [OII] equivalent width to find fraction of galaxies without significant star formation • most galaxies in groups at z~0.4 have significant star formation – in contrast with local groups Fraction of non-SF galaxies Wilman et al. in 2004
Group SFR evolution Groups • Fraction of non-SF galaxies increases with redshift • for both groups and field Fraction of non-SF galaxies Field Fraction of non-SF galaxies Wilman et al. 2004
Group SFR evolution • shape of [OII] distribution evolves with redshift but does not depend on environment • Result sensitive to aperture effects Wilman et al. 2004
Outline • Background • Low redshift: SDSS and 2dFGRS • Groups and clusters at z~0.5 • GALFORM predictions • Conclusions
WIP: GALFORM model • GALFORM is Durham model of galaxy formation (Cole et al. 2000) • parameters fixed to reproduce global properties of galaxies at z=0 (e.g. luminosity function) and abundance of SCUBA galaxies at high redshift • Use mock catalogues of 2dFGRS which include all selection biasses • Predict Ha from Lyman continuum photons, choose dust model to match observed Ha distribution. This is the weak point at the moment. • Assume hot gas is stripped from galaxies when they merge with larger halo (i.e. groups and clusters) which leads to strangulation of SFR (gradual decline)
GALFORM predictions • Fraction of SF galaxies declines with increasing density as in data • Similar results found by Diaferio et al. (2001; z=0.3 CNOC clusters) and Okamoto et al. (2003; morphology-density relation) • Normalisation depends on SFR-Ha transformation, but trend is robust
GALFORM predictions • Over most of the density range, correlation between stellar mass and SFR fraction is invariant • Therefore SFR-density correlation is due to mass-density correlation • At highest densities, models predict fewer SF galaxies at fixed mass due to strangulation • Trend with mass driven by selection effects which make analysis difficult