Download
1 / 21
210 likes | 306 Views
Evaluation of Atmospheric Temperature Profiling off a Building Side in the Early Morning Hours. Ryan Brown Department of Marine and Environmental Systems Florida Institute of Technology Melbourne, Florida 32901 July 20, 2005. Temperature Profiling. Why are we doing this?

E N D
Evaluation of Atmospheric Temperature Profiling off a Building Side in the Early Morning Hours Ryan Brown Department of Marine and Environmental Systems Florida Institute of Technology Melbourne, Florida 32901 July 20, 2005
Temperature Profiling • Why are we doing this? • How the data was collected • Results • Conclusions
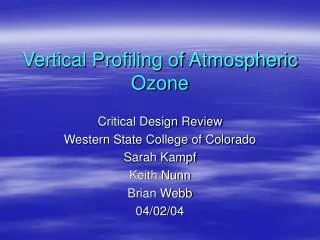
Why are we Doing This? • To locate the Nocturnal Boundary Layer (NBL) • To obtain a low level temperature profile http://lidar.ssec.wisc.edu/papers/akp_thes/node6.htm
What is the NBL? • AMS def.- The cool layer of air adjacent to the ground that forms at night. • Forms from radiative cooling and surface friction • Can extend for a few hundred meters • Interacting processes can occur within the stable NBL • Patchy sporadic turbulence • Internal gravity waves • Drainage flows • Inertial oscillations • Nocturnal jets
What is a Sounding Profile? • A temperature analysis of the atmosphere above one particular spot on the surface • A measures the atmospheric and dew point temperatures http://weather.admin.niu.edu/cgi-bin/getmodel
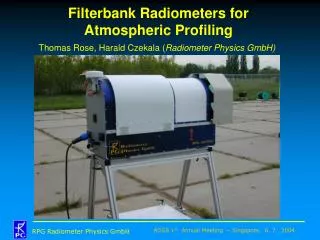
Measuring the Temperature www.fit.edu
Height Depth 22.5 m 2.5 m 20 m 5 m 15 m 10 m 10 m 15 m 5 m 20 m 2.5 m 22.5 m
Measuring the Temperature • A temperature probe was lowered from the top of the building to the bottom • Connected to a laptop on the ground • Two types of runs • Slow, with 1 minute at each depth • Fast, from top to bottom without stopping
June 8 4 total runs 3 slow 1 fast June 9 8 total runs 2 slow 6 fast Simulations Fast Runs What the profile should be without lag Equation based on Newtonian cooling ΔT= Lapse Rate * Velocity * Time + Tempo Measuring the Temperature
A Glance at Real Time Data • Temperature fluctuates ±.035 degrees per second Beginning of Run End of Run Bottom of Building
Fast Run Occurred from 0715 to 0723 Increasing Temp. the whole time The Fast Run of June 8
Conclusions • Temperature Inversion • The Crawford building was underneath the NBL • The Summer months in FL is not the best time to Search for the NBL due to little radiative cooling • NBL is not shallow
Acknowledgements • All Field Project Researchers • Mike Splitt • Pearl Program for Simulations
Questions? Arlena Moses