Download
1 / 15
180 likes | 313 Views
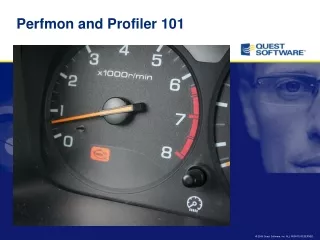
Understanding Perfmon The Performance Testing Tool. >>>>>>>>>>>>>>>>>>>>>> www.softwaretestinggenius.com <<<<<<<<<<<<<<<<<<<<<<. Understanding Perfmon. What is Perfmon Log Settings Creating Graphs Practice Questions.

E N D
Understanding PerfmonThe Performance Testing Tool >>>>>>>>>>>>>>>>>>>>>> www.softwaretestinggenius.com <<<<<<<<<<<<<<<<<<<<<<
Understanding Perfmon What is Perfmon Log Settings Creating Graphs Practice Questions >>>>>>>>>>>>>>>>>>>>>> www.softwaretestinggenius.com <<<<<<<<<<<<<<<<<<<<<<
What is Perfmon Perfmon is a Performance Monitoring tool that is shipped with windows. Performance counters are configured before running the test and it automatically collects the data during the scenario run. >>>>>>>>>>>>>>>>>>>>>> www.softwaretestinggenius.com <<<<<<<<<<<<<<<<<<<<<<
Log Settings Open perfmon by navigating to Start>Run and typing perfmon in the text box. Expand the Performance Logs and tree node and right click on Counter Logs item. Select New Log Settings option and provide a name for the counter say Test_Counter. >>>>>>>>>>>>>>>>>>>>>> www.softwaretestinggenius.com <<<<<<<<<<<<<<<<<<<<<<
Log Settings Notice that Test_Counter window is displayed. Click on Add Counters button and notice that a window is displayed with the following options: Computer Name Performance Object Counters List Instances >>>>>>>>>>>>>>>>>>>>>> www.softwaretestinggenius.com <<<<<<<<<<<<<<<<<<<<<<
Log Settings Select the computer and Performance Object. As there are multiple processes running on a CPU at same time and we have to measure the performance of server only, we select Process Performance Object. Notice that all the current running processes instances are displayed. Select the performance counter and the process that we want to test. >>>>>>>>>>>>>>>>>>>>>> www.softwaretestinggenius.com <<<<<<<<<<<<<<<<<<<<<<
Log Settings To test our Webtour application we will select xigui32 process along with the following counters: %Processing Time: For CPU Usage Working Set: For Memory Usage Click on Add and then Close button. Verify that the counters are added in Counters section. Sample Data: Select the duration in seconds at which we want Perfmon to collect the data. >>>>>>>>>>>>>>>>>>>>>> www.softwaretestinggenius.com <<<<<<<<<<<<<<<<<<<<<<
Log Settings Click on Schedule tab and provide the Start and Stop settings for the log. Manual: Log has to be started manually. Automatic: We can provide the time and date and the perfmon will start automatically. Click on Apply button. >>>>>>>>>>>>>>>>>>>>>> www.softwaretestinggenius.com <<<<<<<<<<<<<<<<<<<<<<
Log Settings Notice that the settings are saved and counter is displayed in the Counter Logs window. For manual configuration log is controlled through Start and Stop buttons >>>>>>>>>>>>>>>>>>>>>> www.softwaretestinggenius.com <<<<<<<<<<<<<<<<<<<<<<
Creating Graphs Open the CSV file from the location that was provided before running the test in Perfmon. To create CPU usage chart: Select the Time, Processor Time columns and click on Chart wizard button. >>>>>>>>>>>>>>>>>>>>>> www.softwaretestinggenius.com <<<<<<<<<<<<<<<<<<<<<<
Creating Graphs Select the Line type graph and click on Next button. Select Columns for Series in field and click Next button. >>>>>>>>>>>>>>>>>>>>>> www.softwaretestinggenius.com <<<<<<<<<<<<<<<<<<<<<<
Creating Graphs Provide Titles for Chart, X axis and Y axis and click Next button. Click on legend tab and select Top option. >>>>>>>>>>>>>>>>>>>>>> www.softwaretestinggenius.com <<<<<<<<<<<<<<<<<<<<<<
Creating Graphs Click Finish and notice that the chart is created. Similarly the chart can be created for memory usage through the Working Set column. Analyze the Perfmon Graphs to determine whether the application in CPU intensive or Memory intensive. >>>>>>>>>>>>>>>>>>>>>> www.softwaretestinggenius.com <<<<<<<<<<<<<<<<<<<<<<
Configure log settings for the scenario. Execute the scenario with Perfmon. Create graphs from the .csv file created through Perfmon. Analyze the graphs to determine whether the application is memory bound or CPU bound. Questions - To Review Your Skills >>>>>>>>>>>>>>>>>>>>>> www.softwaretestinggenius.com <<<<<<<<<<<<<<<<<<<<<<
Thank You >>>>>>>>>>>>>>>>>>>>>> www.softwaretestinggenius.com <<<<<<<<<<<<<<<<<<<<<<