Download
1 / 24
240 likes | 328 Views
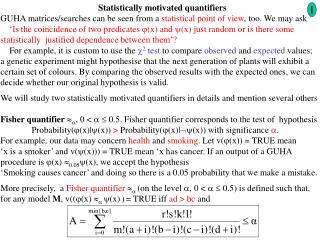
Evaluate Statistically Based Reports ( AS 3.12). Workshop 1. Dru Rose (Westlake Girls High School, Ministry of Education Study Award ) Rachel Passmore (Endeavour Teacher Fellow) Angela Hawkins ( Rosehill College). What does AS 3.12 cover?. Polls and Surveys

E N D
Evaluate Statistically Based Reports ( AS 3.12) Workshop 1 Dru Rose (Westlake Girls High School, Ministry of Education Study Award) Rachel Passmore(Endeavour Teacher Fellow) Angela Hawkins (Rosehill College)
What does AS 3.12 cover? • Polls and Surveys • Non-sampling errors and survey concerns • Sampling error (margin of error, 95% confidence intervals, testing claims made - Workshop A) • Experimental and Observational Studies
Why teach AS3.12 ? • Statistical Literacy is an essential life-skill to function effectively in the information age (Wallman, 1993; Gal, 2002) • Broadens students’ horizons, taking statistical understanding beyond the classroom into the real world (a motivational aspect for students in the trial) • Accessible to less academic students • External standard • Only pre-requisite is AS2.9 (possibly just 1.10) • Links to other standards students may be taking(formal inference AS3.10, experiments AS3.11, bi-variate data AS 3.9)
Suggested timeline for 2013 About 4 to 5 weeks • Polls and surveys : • Introduction to non-sampling errors and survey concerns ≈6 periods • margin of error, 95% confidence intervals, testing claims ≈ 7 periods • Experimental and observational studies ≈ 7 periods
Evaluating reports involving polls and surveys How should we teach this ? (someapproaches that seem to work) • Teacher modelling + group work + individual practice • Literacysupport: • Pre-reading strategies-look at the structure of media reports, skim-reading to “get the gist”, identify and discuss problem vocabulary • While-reading strategies-read text aloud asking “worry” questions, record answers on a writing frame • Post-reading strategies-write a 3 sentence summary, note 2 positive aspects, note 2 concerns, organise into a short report
How should we teach this ? • Begin with familiar contexts and gradually move to unfamiliar (examples in resource pack- ask students to find some too) • Use “stories” to illustrate the various non-sampling errors and survey concerns(power-point in resource pack- ask students to add examples of their own) • Rephrase student comments from informaltoformalstatistical language(Encourage students to use the correct terminology in their reports - a step up from AS2.11) • Allow Time (e.g. one report per lesson – one or two non-sampling errors at time until all covered –can keep non-sampling errors and survey concerns going even when moving on to look at sampling error)
What are polls and surveys? Do you have an internet capable mobile device with you today? “ % of New Zealanders carry an internet capable mobile device, survey finds” Any concerns about this statement?
A possible student poll : What type of driving licence do you hold ? (full, restricted, learner, none) • Use poll to explore and extend students’ existing statistical knowledge base regarding: target population, sample, random selection, making an inference • extend students’ view of sampling from classroom activities to sampling of the wider NZ population Students need an idea of how key characteristics such as : gender, age, ethnicity, regions of residence, income are distributed across NZ population (A common student misconception : for a NZ survey on health the sample should have equal numbers of smokers and non-smokers) • Look at methodologies used by research companieseg DIGIPOLL, COLMAR BRUNTON, HORIZON etc.(in power-point on political polls in resource pack)
Sampling Error (random process) Non-sampling Errors Sampling Selection bias Non-response bias Self selection Question effects Behavioural considerations Interviewer effects Survey-format effects Transfer findings
Interviewer Effects in Racial Questions In 1968, one year after a major racial disturbance in Detroit, a sample of black residents were asked: “Do you personally feel that you trust most white people, some white people or none at all?” • White interviewer: 35% answered “most” • Black interviewer: 7% answered “most”
The resource pack for this workshop has 4 media reports: • Driving infringements –Digipoll (good methodology), question concerns-illustrates structure of media reports • Road tolls– Horizon on-line panel, potential selection bias, non-response bias, question concerns, funding concerns-”Worry Questions” sheet and writing frame • Potential for DVT in office workers – a more difficult context but relevant and interesting to students -funding concerns, question concerns, selection concerns- a chance to discuss definitions • NZ-US military –Digipoll (good methodology), a move to a more difficult context- demonstrate “reading aloud”-how to make meaning from context-need to discuss background re ANZUS, NZ non-nuclear stance
What is an Experiment? • Participants randomly allocated to treatments • Variable of interest is measured and results compared between treatment groups • Causal claim can be made Dru Rose, Angela Hawkins and Rachel Passmore
KEY TERMINOLOGY • Response Variables – the variable measured as the outcome of an experiment. Measure blood pressure to assess effect of new drug. • Explanatory Variables – the variable that attempts to explain differences in the response variable • Treatment- one or a combination of explanatory variables assigned by the researcher • Confounding Variables – variables connected to the explanatory variable that may be the actual cause of the differences in the response variable. Dru Rose, Angela Hawkins and Rachel Passmore
How to design a good experiment • Random Allocation – participants randomly allocated to treatments and random order of treatment • Use of a Control Group – use to establish base line effect • Use of a Placebo – dummy, existing or no treatment • Use of Blinding – single and double blinding Dru Rose, Angela Hawkins and Rachel Passmore
What is an Observational Study? A study which observes differences in the explanatory variable and then assesses whether these differences are related to differences in the response variable A CAUSAL CLAIM CANNOT BE MADE Famous NZ Observational Study is the Dunedin Multidisciplinary Health and Development Study (DMHDS) .A study of 1037 children who were born in Dunedin, in 1972-73. Where they now live shown below. Dru Rose, Angela Hawkins and Rachel Passmore
Potential Problems with Observational Studies Confounding Variables “Happy People Live Longer” • Possible Confounding variables – Health, Life-style, Economic status, Family……… • Why is this an Observational Study? Cannot force people to be happy ! • Problem – a causal claim has been made. Dru Rose, Angela Hawkins and Rachel Passmore
Potential Problems with Observational Studies Extending Results inappropriately “WOMEN HIT HARDER BY HANGOVERS” PROBLEM The study observed only undergraduate students at one University so results cannot be extended to cover ALL WOMEN Dru Rose, Angela Hawkins and Rachel Passmore
Potential Problems with Observational Studies Using the past as a source of data “LEFT HANDED PEOPLE DIE YOUNGER” In early part of twentieth century children forced to write with right hands, hence greater numbers of right-handers. PROBLEM Confounding variables can change over time. Recalled information often unreliable. Dru Rose, Angela Hawkins and Rachel Passmore
COMPARISON OF EXPERIMENTS AND OBSERVATIONAL STUDIES Dru Rose, Angela Hawkins and Rachel Passmore
Writing frame for critically evaluating a report Dru Rose, Angela Hawkins and Rachel Passmore
EXAMPLE OF EXAM STYLE QUESTION QUESTION TWO Extract from Newspaper article “GRADUATING IS GOOD FOR YOUR HEALTH” College graduates feel better emotionally and physically than their high-school drop-out counterparts, a study of over 400,000 US adults reveals. Participants were asked a series of questions including level of education and on how many of the past 30 days they felt physically and emotionally healthy. • Define the explanatory and response variables • Explain whether any of the potential problems that observational studies can suffer from might apply to this study. • Evaluation steps 5, 6 & 7 are concerned with measurements taken and who was studied. Discuss these steps in relation to this study Dru Rose, Angela Hawkins and Rachel Passmore
POSSIBLE RESPONSES TO QUESTION • Explanatory Variable is level of education, Response variable is Emotional & Physical Health • Recall of information over last 30 days may be unreliable, generalising to ‘ good for your health’ but study only in US, confounding variables – many other factors contribute to Emotional & Physical Health – social network, economic status, family, illness etc • No information provided about who participants were or how they were selected other than that they were from USA. Unclear exactly what questions were asked to determine how healthy students were so not sure if they provided a good indicator of health or not. Responses to these questions might vary depending on when the • question was asked & how the student was feeling at that time. They • might also vary depending on who was asking the questions or how • responses were collected. Dru Rose, Angela Hawkins and Rachel Passmore