Download
1 / 3
30 likes | 158 Views
Given a data set = { x 1 , x 2 , . . . , x n }, we discussed three common numerical measures of spread for its frequency distribution:. Range = x max - x min : Measures the length of the interval over which the entire set of data values is spread.

E N D
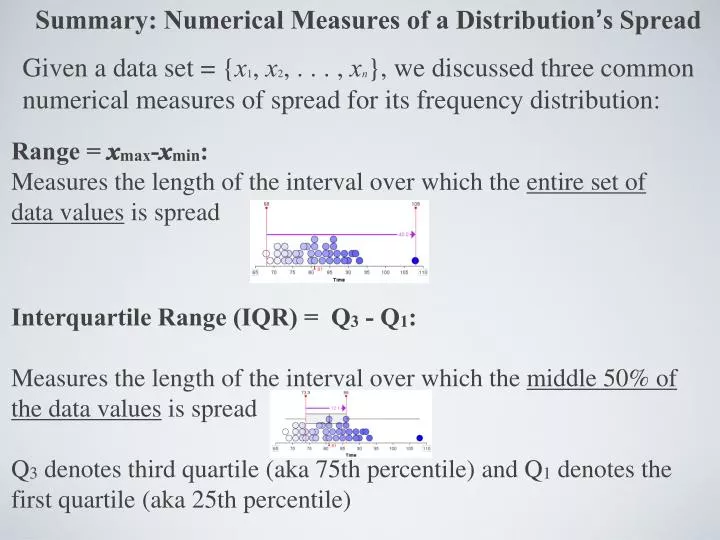
Given a data set = {x1, x2, . . . , xn}, we discussed three common numerical measures of spread for its frequency distribution: Range = xmax-xmin: Measures the length of the interval over which the entire set of data values is spread • Summary: Numerical Measures of a Distribution’s Spread Interquartile Range (IQR) = Q3 - Q1: Measures the length of the interval over which the middle 50% of the data values is spread Q3 denotes third quartile (aka 75th percentile) and Q1 denotes the first quartile (aka 25th percentile)
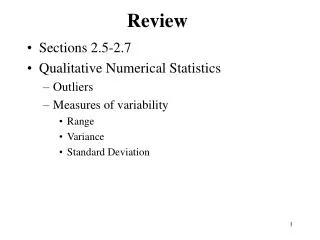
3. Standard deviation Gives an average of the squared deviations from the mean in the same units of measure as the data (thus the square root). Properties of S: • S measures the spread of the data about the mean—it should • only be used when the mean is chosen as a measure of center • S > 0 for any data set: • S = 0 if and only if ___?______. Otherwise, S > 0. • The farther the data is spread from the mean, the greater S gets. • S is thus very sensitive to extreme differences from the mean.
Why? • Because in addition to specifying a center, it can be used to also measure the length of intervals within which the four ordered quarters of the data are contained, and thus measures the variability/spread of those portions: Q1-xmin, M-Q1, Q3-M, xmax -Q3 • The Five-Number Summary provides a fairly complete summary of a distribution’s center and spread • xminQ1 M Q3 xmax The Five-Number summary forms the skeleton for the boxplot