Download
1 / 8
80 likes | 190 Views
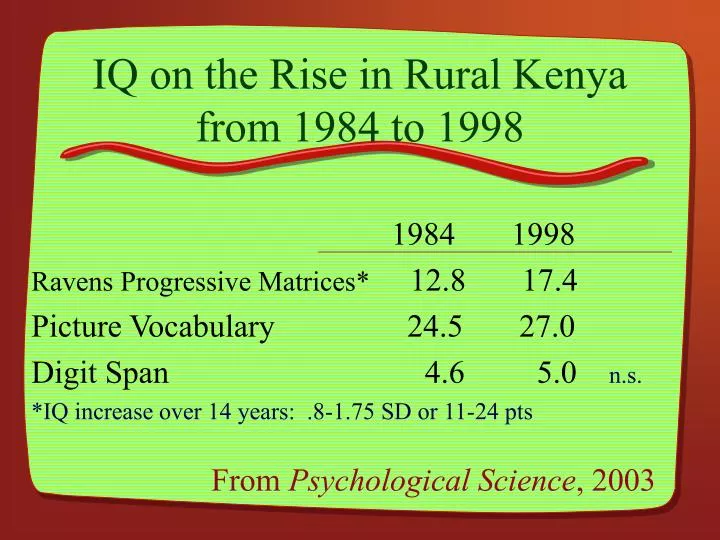
IQ on the Rise in Rural Kenya from 1984 to 1998. 1984 1998 Ravens Progressive Matrices* 12.8 17.4 Picture Vocabulary 24.5 27.0 Digit Span 4.6 5.0 n.s.

E N D
IQ on the Rise in Rural Kenya from 1984 to 1998 • 1984 1998 • Ravens Progressive Matrices* 12.8 17.4 • Picture Vocabulary 24.5 27.0 • Digit Span 4.6 5.0 n.s. • *IQ increase over 14 years: .8-1.75 SD or 11-24 pts From Psychological Science, 2003
What Factors are Implicated? • 1984 1998 • Food intake: Energy (kilocalories) 1,506 1,762 • Protein 44 g 53 g • Health status: hemoglobin deficiency 10% 27% • (e.g., iron, vitamin, folic acid deficiency) • Hookworm: 36% 18%
Have children learned to be better test-takers? • Authors argue No. The 3 tests administered are very different from Kenyan standardized tests and are not familiar to Embu teachers.
Environmental Complexity? • 1984 1998 • Prefrabricated toys and games Absent Absent • placemats in restaurants Absent Absent • Cereal boxes Absent Absent • Household with television 0% 9% • Billboards, complicated visual packaging unknown
Are Family Demographics Relevant? • 1984 1998 • Family factors: Household members 9.2 6.7 • Family structure: Fathers away from home • for 8 months of a year: 4% 8% • Unmarried mothers 0% 16%
Maternal Education and Literacy • 1984 1998 • Mother reported no schooling 26% 8% • Mothers with more than 8 years education 7% 17% • Mother average reading level 4th grade 8th grade • Fathers’ educational levels also rose slightly between 1984 and 1998, but not as strikingly as mothers’ levels. • In 1998 31% of parents belonged to parents’ association at school; • 16% of total household budget spent on school related expenses
Were School factors relevant? • Elementary School? Probably not: • All children in both cohorts attended school, but had only attended school for 4 months when tested. • 1984 1998 • Preschool may have mattered: 7% 15%
Questions • What factors are likely responsible for the dramatic rise in IQ in 14 years in rural Kenya? • Which of these factors are unique to Kenya? • Which are similar to those that may have influenced the IQ rise in the industrialized west?