Download
1 / 26
260 likes | 266 Views
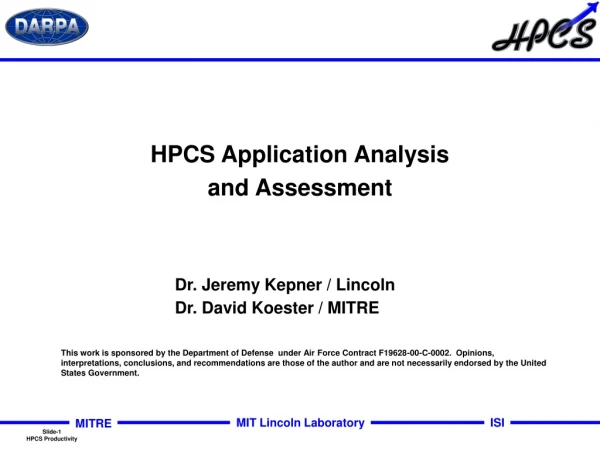
HPCS HPCchallenge Benchmark Suite. David Koester, Ph.D. (MITRE) Jack Dongarra (UTK) Piotr Luszczek (ICL/UTK) 28 September 2004. Outline. Brief DARPA HPCS Overview Architecture/Application Characterization HPCchallenge Benchmarks Preliminary Results Summary.

E N D
HPCS HPCchallenge Benchmark Suite David Koester, Ph.D. (MITRE)Jack Dongarra (UTK)Piotr Luszczek (ICL/UTK) 28 September 2004
Outline • Brief DARPA HPCS Overview • Architecture/Application Characterization • HPCchallenge Benchmarks • Preliminary Results • Summary
High Productivity Computing Systems • Create a new generation of economically viable computing systems and a procurement methodology for the security/industrial community (2007 – 2010) Impact: • Performance (time-to-solution): speedup critical national security applications by a factor of 10X to 40X • Programmability (idea-to-first-solution): reduce cost and time of developing application solutions • Portability (transparency): insulate research and operational application software from system • Robustness (reliability): apply all known techniques to protect against outside attacks, hardware faults, & programming errors HPCS Program Focus Areas • Applications: • Intelligence/surveillance, reconnaissance, cryptanalysis, weapons analysis, airborne contaminant modeling and biotechnology Fill the Critical Technology and Capability Gap Today (late 80’s HPC technology)…..to…..Future (Quantum/Bio Computing)
High Productivity Computing Systems -Program Overview- • Create a new generation of economically viable computing systems and a procurement methodology for the security/industrial community (2007 – 2010) Half-Way Point Phase 2 Petascale/s Systems Full Scale Development Vendors TechnologyAssessment Review Validated Procurement Evaluation Methodology Advanced Design & Prototypes Test Evaluation Framework Productivity Team New Evaluation Framework Concept Study Phase 3 (2006-2010) Phase 1 Phase 2 (2003-2005)
HPCS Program Goals‡ • HPCS overall productivity goals: • Execution (sustained performance) • 1 Petaflop/sec (scalable to greater than 4 Petaflop/sec) • Reference: Production workflow • Development • 10X over today’s systems • Reference: Lone researcher and Enterprise workflows • Productivity Framework • Base lined for today’s systems • Successfully used to evaluate the vendors emerging productivity techniques • Provide a solid reference for evaluation of vendor’s proposed Phase III designs. • Subsystem Performance Indicators • 2+ PF/s LINPACK • 6.5 PB/sec data STREAM bandwidth • 3.2 PB/sec bisection bandwidth • 64,000 GUPS ‡Bob Graybill (DARPA/IPTO) (Emphasis added)
Outline • Brief DARPA HPCS Overview • Architecture/Application Characterization • HPCchallenge Benchmarks • Preliminary Results • Summary
Processor-Memory Performance Gap µProc 60%/yr. 1000 CPU “Moore’s Law” 100 Processor-Memory Performance Gap:(grows 50% / year) Performance 10 DRAM 7%/yr. DRAM 1 1989 1990 2000 1980 1981 1982 1983 1984 1985 1986 1987 1988 1991 1992 1993 1994 1995 1996 1997 1998 1999 • Alpha 21264 full cache miss / instructions executed: 180 ns/1.7 ns =108 clks x 4 or 432 instructions • Caches in Pentium Pro: 64% area, 88% transistors • *Taken from Patterson-Keeton Talk to SigMod
Processing vs. Memory Access • Doesn’t cache solve this problem? • It depends. With small amounts of contiguous data, usually. With large amounts of non-contiguous data, usually not • In most computers the programmer has no control over cache • Often “a few” Bytes/FLOP is considered OK • However, consider operations on the transpose of a matrix (e.g., for adjunct problems) • Xa= b XTa = b • If X is big enough, 100% cache misses are guaranteed, and we need at least 8 Bytes/FLOP (assuming a and b can be held in cache) • Latency and limited bandwidth of processor-memory and node-node communications are major limiters of performance for scientific computation
Processing vs. Memory AccessHigh Performance LINPACK Consider another benchmark: Linpack A x = b Solve this linear equation for the vector x, where A is a known matrix, and b is a known vector. Linpack uses the BLAS routines, which divide A into blocks. On the average Linpack requires 1 memory reference for every 2 FLOPs, or 4Bytes/Flop. Many of these can be cache references
Processing vs. Memory AccessSTREAM TRIAD Consider the simple benchmark: STREAM TRIAD a(i) = b(i) + q * c(i) a(i), b(i), and c(i) are vectors; q is a scalarVector length is chosen to be much longer than cache size Each execution includes2 memory loads + 1 memory store2 FLOPs12 Bytes/FLOP (assuming 32 bit precision) No computer has enough memory bandwidth to reference12 Bytes for each FLOP!
Processing vs. Memory AccessRandomAccess Bit-LevelExclusive Or The Commutative and Associative nature of allows processing in any order The expected value of the number of accesses per memory location T[ k ] E[ T[ k ] ] = (2n+2 / 2n) = 4 Tables 64 bits T 2n1/2 Memory k T[ k ] ai DefineAddresses k = [ai <63, 64-n>] Highest n bits Sequences ofbits within ai Data Stream {Ai} Length 2n+2 Data-DrivenMemory Access Acceptable Error — 1% Look ahead and Storage — 1024 per “node” ai 64 bits
Outline • Brief DARPA HPCS Overview • Architecture/Application Characterization • HPCchallenge Benchmarks • Preliminary Results • Summary
HPCS HPCchallenge Benchmarks • HPCSchallenge Benchmarks • Being developed by Jack Dongarra (ICL/UT) • Funded by the DARPA High Productivity Computing Systems (HPCS) program (Bob Graybill (DARPA/IPTO)) • To examine the performance of High Performance Computer (HPC) architectures using kernels with more challenging memory access patterns than High Performance Linpack (HPL)
HPCchallenge Goals • To examine the performance of HPC architectures using kernels with more challenging memory access patterns than HPL • HPL works well on all architectures ― even cache-based, distributed memory multiprocessors due to • Extensive memory reuse • Scalable with respect to the amount of computation • Scalable with respect to the communication volume • Extensive optimization of the software • To complement the Top500 list • To provide benchmarks that bound the performance of many real applications as a function of memory access characteristics ― e.g., spatial and temporal locality
Local DGEMM (matrix x matrix multiply) STREAM COPY SCALE ADD TRIADD EP-RandomAccess 1D FFT Global High Performance LINPACK (HPL) PTRANS — parallel matrix transpose G-RandomAccess 1D FFT b_eff — interprocessor bandwidth and latency HPCchallenge Benchmarks FFT EP-RandomAccess DGEMM STREAM FFT G-RandomAccess HPL PTRANS • HPCchallenge pushes spatial and temporal boundaries; sets performance bounds • Available for download http://icl.cs.utk.edu/hpcc/
Web Sitehttp://icl.cs.utk.edu/hpcc/ • Home • Rules • News • Download • FAQ • Links • Collaborators • Sponsors • Upload • Results
Outline • Brief DARPA HPCS Overview • Architecture/Application Characterization • HPCchallenge Benchmarks • Preliminary Results • Summary
Outline • Brief DARPA HPCS Overview • Architecture/Application Characterization • HPCchallenge Benchmarks • Preliminary Results • Summary
Summary • DARPA HPCS Subsystem Performance Indicators • 2+ PF/s LINPACK • 6.5 PB/sec data STREAM bandwidth • 3.2 PB/sec bisection bandwidth • 64,000 GUPS • Important to understand architecture/application characterization • Where did all the lost “Moore’s Law performance go?” • HPCchallenge Benchmarks — http://icl.cs.utk.edu/hpcc/ • Peruse the results! • Contribute!