Download
1 / 86
860 likes | 1.06k Views
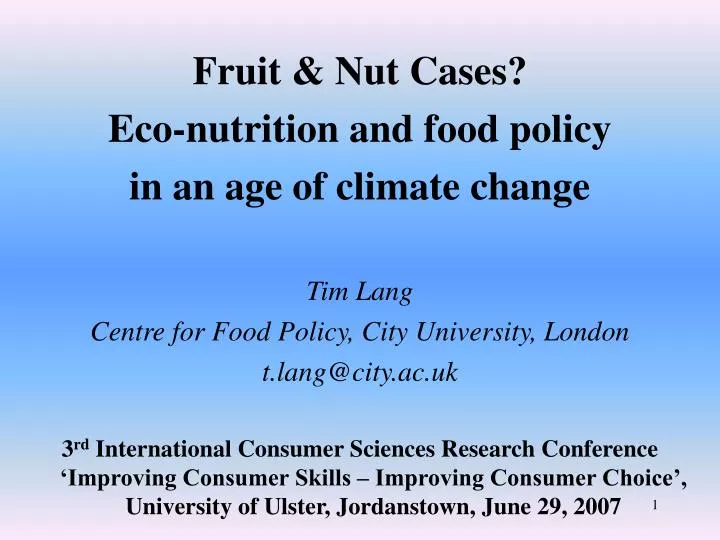
Fruit & Nut Cases? Eco-nutrition and food policy in an age of climate change Tim Lang Centre for Food Policy, City University, London t.lang@city.ac.uk

E N D
Fruit & Nut Cases? Eco-nutrition and food policy in an age of climate change Tim Lang Centre for Food Policy, City University, London t.lang@city.ac.uk 3rd International Consumer Sciences Research Conference ‘Improving Consumer Skills – Improving Consumer Choice’, University of Ulster, Jordanstown, June 29, 2007
Overview of this talk: • The impact of diet on health is well known • The nutrition transition is now globalising • Environmental determinants now loom alongside health as shapers of C21st food • Big changes will happen in what we eat, how it’s produced &what land is used for • Professions must engage with this picture • The eco-nutrition transition must be democratised rather than forced on us
Issue 1 The productionist paradigm (which has shaped C20th food supply) is under stress
Agricultural Revolution Life Sciences Integration paradigm Industrialis-ation of Food Chemical Revolution Ecologically Integrated paradigm Transport Revolution Life sciences vs. ecology?The paradigm battle Food Wars Productionist paradigm 1800s 1900s 1950 2000 2050 LEGEND: = Key Battlegrounds in the Food Wars. These include: ·Diet, health and disease prevention ·Capturing the consumer ·What sort of food business ·Environmental crisis ·Controlling food supply ·Competing visions / ideologies
Implications • Although big money has been invested in Life Sciences, ecological perspectives are themselves becoming central • Big consumer goods companies (including food co.s) are rapidly trying to address this change. • ‘Markets’ are being redefined
Issue 2 Consumers’ food culture is troubled - going in contradictory directions simultaneously
Animal welfare Human health Methods of production + impact (eg, environmental, landscape) Terms of trade (fair price, etc) Quality (taste, composition, etc) Origin and place Trust Voice (participation) Transparency Working conditions Other values than ‘value for money’ appeal to food consumers Source: Coff, Korthals, Barling, eds (2007) Ethical Traceability project (EU 6th framework), forthcoming book or see: www.food-ethics.net
Implications • How can consumers juggle and reconcile competing demands? • There are no guidelines for addressing ‘single issues’ together • A battle is on for the collective consciousness / culture • Are there signs of a shift from ‘value for money’ to ‘values for money’?
Issue 3 Climate change is rapidly emerging as a (? the) major policy challenge. It alters notions of progress and the future. [Here, I draw on J Holdren’s AAAS Presidential Address Feb 2007]
The problem: the Earth is getting warmer. °C Green bars show 95% confidence intervals 2005 was the hottest year on record; the 13 hottest all occurred since 1990, 23 out of the 24 hottest since 1980. J. Hansen et al., PNAS 103: 14288-293 (26 Sept 2006)
With the causal link to greenhouse gases Source: Hansen et al., Science308, 1431, 2005.
Changes in climate are already causing harm Major floods per decade, 1950-2000 There’s a consistent 50-year upward trend in every region except Oceania.
Harm is already occurring (continued) Major wildfires by decade, 1950-2000 The trend has been sharply upward everywhere.
Where we’re headed: Heat waves Extreme heat waves in Europe, already 2X more frequent because of global warming, will be “normal” in mid-range scenario by 2050 Black lines are observed temps, smoothed & unsmoothed; red, blue, & green lines are Hadley Centre simulations w natural & anthropogenic forcing; yellow is natural only. Asterisk and inset show 2003 heat wave that killed 35,000. Stott et al., Nature 432: 610-613 (2004)
Harm is already occurring (continued) Total power released by tropical cyclones (green) has increased along with sea surface temperatures (blue). Source: Kerry Emanuel, MIT, http://wind.mit.edu/~emanuel/anthro2.htm. SST anomaly (deg C) with arbitrary vertical offset. PDI scaled by constant. Kerry Emanuel, MIT, 2006
Harm is already occurring (concluded) WHO estimates climate change already causing ≥150,000 premature deaths/yr in 2000
But temp. rises will lead to lower yields in tropics Crop yields in tropics start dropping at ∆T ≥ 1-1.5°C Easterling and Apps, 2005
Where we’re headed: droughts Drought projections for IPCC‘s A1B scenario Percentage change in average duration of longest dry period, 30-year average for 2071-2100 compared to that for 1961-1990.
Implications • What we are doing to land (ie the planet) is shaping what happens on the planet • This raises a fundamental policy question: what is land for? • There are competing demands: • Social: amenity, housing, cultural identity, • Environmental: carbon sink, water, biodiversity • Economic: fuel, food, resources (minerals)
Issue 4 Climate change is not the only environmental driver about to re-shape and deepen pressures on consumer food culture
Environment and food culture • Emissions from food transport • Oil and Energy use • Mobility: oil not food as fuel • Water use by population • Water use by products
Oil & energy • IEA est. oil / energy demand growth 2000-30 = 1.7% per yr • = equivalent to +60% on today’s consumption • 60% of demand growth will come from DCs (esp. China and India) • Biofuels no solution land use pressure: food vs biofuels vs amenity vs housing vs carbon sinks vs identity (views)
Rise of motorised transport 1930-2000 Michael P Walsh, Motor Vehicle Pollution Control, Paper to China Fuel Economy Workshop, Hong Kong, December 13, 2004, http://www.walshcarlines.com/china/Applying%20The%20Lessons%20To%20China%20-%20MOVE%20.pdf
Water futures • 2000-2020 : water availability for humans is expected to drop by one-third • Water scarcity or stress (having less than 1,700 cubic metres of water per person per year) is estimated to affect 40% of humanity by 2050 Consequences: 1. increased food prices and health threats; 2. poor countries likely to be most heavily affected Stockholm International Water Institute (2003). General water statistics: World Water Week Symposium data sheets, August 10-16. Stockholm: Stockholm International Water Insitute www.siwi.org/waterweek2003 Cosgrave W, Vice-President of the World Water Council, quoted in Houlder V (2003), ‘World in drier straits’, Financial Times, 11 August, p 16
. Source:http://www.solcomhouse.com/drought.htm Accessed 17 May 2004
World population by freshwater availability 2000 & 2025 • Source: Marie Stopes International, evidence to All Party Parliamentary Group on Population, Development and Reproductive Health (2007) ‘Return of the Population Factor: its impact on the Millennium Development Goals’. London: House of Commons. Jan. Fig 22 pg 52 http://www.appg-popdevrh.org.uk/Publications/Population%20Hearings/APPG%20Report%20-%20Return%20of%20the%20Population%20Factor.pdf
glass beer (250ml) = 75 glass milk (200ml) = 200 glass wine (125ml) = 120 glass apple juice (125ml) =190 cup coffee (125ml) = 140 cup of tea (125ml) = 35 slice of bread (30g) = 40 slice of bread (30g) with cheese (10g) = 90 1 potato (100g) = 25 1 bag of potato crisps (200g) =185 1 egg (40g) = 135 1 hamburger (150g) = 2400 1 cotton T-shirt (medium, 500g) = 4100 1 sheet A4 paper (80g/m20) = 10 1 pair of shoes (bovine leather) = 8000 1 microchip (2g) = 32 Products’ virtual water content (litres) Source: WWF (2006) rich countries, poor water. www.panda.org/freshwater
Meat’s water demands ….creeping into policy • 1 kg grain-fed beef needs 15 cubic metres of water • 1 kg of lamb from a sheep fed on grass needs 10 cubic metres • 1kg cereals needs 0.4-3 cubic metres Source: Anders Berntell, Stockholm International Water Institute, World Water week interview, BBC News Online, August 27 2005
Global social justice: who emits the most carbon dioxide? • Source: World Resources Institute (2006) climate analysis indicators tool version 3.0 (www.wri.org)
Implications • The ‘eco’ challenge to food system is real • Food industry response too niche/ tokenist • Decline of State leadership means no shared framework exists just when needed • Pressures will grow
Issue 5Health pressures are similar to environmental ones.Again, the policy focus is on individualism, choice & consumerism as drivers, when they are being driven.
Health: what’s the problem? (WHO consensus e.g. TR916) • Rising toll of NCDs – including most visibly obesity and diabetes • Growing economic burden: healthcare • Creation of health inequalities • The spread of ‘Western’ diets and companies to the developing world
WHO (2005) Preventing Chronic Diseases: a vital investment. Overview. Geneva: WHO p.12
Source: WHO (2005) Preventing Chronic Diseases: a vital investment. Overview. Geneva: WHO p.4
Yearly deaths due to risk factors associated with tobacco, diet and physical inactivity • 4.9 m people die as a result of tobacco use • 2.6 m people die as a result of being overweight or obese • 4.4 m people die as a result of raised total cholesterol levels • 7.1 m people die as a result of raised blood pressure. WHO (2005) Preventing Chronic Diseases: a vital investment. Overview. Geneva: WHO p.6
WHO (2005) Preventing Chronic Diseases: a vital investment. Overview. Geneva: WHO p.5
Implications • ‘Personalised’ healthcare choice is no adequate policy response (it appeals to rich countries and the ‘worried well’) • Developing countries, too, face big burdens • Diet-related healthcare costs will rise fiscal pressure on prevention • Obesity is to health what climate change is to environment both attract policy attention because both are systemic crises
Issue 6The normalisation of what is damaging is now part of the problem. How can we shift absurdities which have been normalised? Two examples are information (said to be key to change) and waste.
Health ideal vs. TV advertising reality (UK)Source: IACFO 2003
The rise and rise of advertising • McDonalds and Coca-Cola spend c$1.7bn each globally per year • = more than total annual expenditure of WHO on everything • Policy response to tensions = diversification, e.g. sponsorship, virtual, viral, texting, whispering, product placement, etc…
‘NORMAL’ Brand: design etc Logo Maker & contact Packaging: recycle? Ingredients ‘EMERGING’ Nutrition (if health claim) Production method Social: fair trade Animal welfare Allergy Climate: carbon ‘C’ Can labelling deliver?All this in 2 seconds to choose!
Food waste (UK): WRAP study 2007 • 6.7 mt food thrown yearly = c 30% all food bought = 19% of domestic waste = more weight than food packing • 70% fd waste landfill methane (23x more powerful a climate changing gas than CO2) • 1/2 food waste could be eaten = equiv. 18mt CO2 = equiv. losing 20% all cars
What do we say we throw away?Source: WRAP 2007 32% - food cooked & left uneaten on plate 24% - food prepared but not cooked 24% - products opened but not finished 56% - inedible: peelings, cores, outer leaves 30% - fruit, vegetables, salad
WRAP asks: are UK consumers in denial?… • 90% of households don’t believe that they waste much food • 50% care ‘a great deal’ or ‘fairly’ • 50% care ‘a little’, ‘not much’ or ‘not at all’
Implications • Information democracy is at the heart of the neo-liberal efficient market model • …but…(excessive) choice is part of the ecological and cultural problem • Information not a trigger for behaviour change (but a reinforcer) • Signs of information overload? • Are consumer values in a muddle?