Download
1 / 21
220 likes | 343 Views
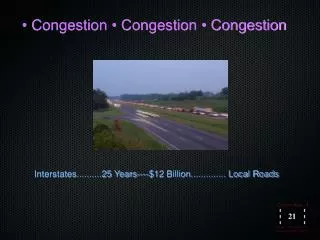
Hertfordshire Congestion Topic Group. 11 June 2010. How congestion affects bus services. Increases journey times Reduces frequencies and level of service Increases number of buses needed to provide same frequency Increases costs and eventually fares Persuades fewer people to use the bus

E N D
Hertfordshire Congestion Topic Group 11 June 2010
How congestion affects bus services • Increases journey times • Reduces frequencies and level of service • Increases number of buses needed to provide same frequency • Increases costs and eventually fares • Persuades fewer people to use the bus • Makes services unreliable • Reduces trust in buses • Makes services difficult to plan and manage • Increases costs and eventually fares • Persuades fewer people to use the bus
Why does this matter? • Arriva the Shires alone carries 16.7 million passengers per year in Hertfordshire • Achieving modal shift from cars to buses can help to reduce congestion • The Traffic Commissioner now has powers to call local authorities to public enquires over bus punctuality as well as operators • Arriva’s Customer Satisfaction Surveys consistently place punctuality and reliability at the top of their most important issues
Traffic Commissioners’ punctuality targets • On frequent services – on at least 95% of occasions 6 or more buses will depart within any period of 60 minutes and the interval between consecutive buses will not exceed 15 minutes • On timetabled services – 95% of buses will depart within the window of tolerance of ‘up to 1 minute early or up to 5 minutes late’ • On timetables services – 95% of all services are expected to arrive at the final destination point no more than 5 minutes late • Annual bus national punctuality statistics for 2007 showed 75% of buses departed on time
How can buses help to reduce congestion? • The Office for National Statistics omnibus surveys shows: • 48% of car users say they would use the car less if buses were quick and frequent • 51% say they would use their cars less if buses were within easy walking distance of each end of their journey • 56% say they would use buses more if car parking were expensive • 64% say they would use buses more if it were difficult to find somewhere to park the car
How can buses help to reduce congestion? • Before and after surveys in Dublin showed that from upgraded bus routes for every 1 minute saving in bus journey time 1.22% transferred from car to bus • Source – Commission for Integrated Transport
How can buses help to reduce congestion? • TAS has shown from generalised modelling on a sample corridor: • A combination of journey time and reliability improvements could increase bus market share from 16.3% to 19.5%, and reduce car market share from 69.4% to 66.8% • If accompanied by a £2 increase in car parking charges the bus market share would increase to 25.2% and car market share reduce to 57%
How can buses help to reduce congestion? • First Group introduced identical network simplification and fleet improvements in York, Aberdeen and Bradford • In York parking policy restricted spaces and introduced a 3 hour parking limit on parking in the City Centre • Patronage growth in Bradford – 6% • Patronage growth in Aberdeen – 14% (free concessionary fares scheme introduced in the interim) • Patronage growth in York – 25%
Experience in Hertfordshire Changes in peak running times over the last 10 years Woodside – Watford Town Centre +95% Garston – Berry Lane +94% Garston – Watford Town Centre +43% Northwood – Watford Town Centre +33% Holywell – Watford Town Centre +32% Borehamwood Station – Watford Town Centre +31%
For example… Service 321 – Luton Watford 1998 – 0717 to 0837 80 minutes 2008 – 0720 to 0925 125 minutes An increase of 45 minutes!
For example… Service 724 0540 journey requires 36 minutes extra running time than 0517 journey Equivalent Saturday journey takes 51 minutes less running time (31% less)
Unpredictable peak flows Thursday 27/11/08 (1600 -1830) – Typical day St Albans Rd (Railway Bridge) Market St 30 buses – Average of 8 minutes journey time Quickest 4minutes, Slowest 16minutes Market St St Albans Rd (Railway Bridge) 29 buses – Average of 9 minutes journey time Quickest 6minutes, Slowest 17 minutes
A small problem causes huge delays Broken down car at traffic lights of junction, Beechen Grove & Loates Lane Watford Junction Bushey Station
Improvement targets Bus journey times • Journey times must be competitive to other modes • This should include onward journey times (e.g. the walk from the bus to key shopping areas vs the walk from a central car park
Improvement targets Bus journey predictability • Variability must be reduced as much as possible • Reduced variability in journey times makes trips more predictable to passengers • A reduction in variability leads to a reduced requirement for recovery time
How can bus punctuality and attractiveness be improved? • Operators to develop realistic schedules • Provision of bus priority wherever possible • Maximising self enforcing measures • Protection of bus stops • Enforcement of traffic regulation orders • Management and planning of roadworks • Accessibility to traffic generators
Parking Inconsiderate and illegal parking • Creates delays if bus can't pass unless oncoming traffic allows it to • Occasionally bus can't pass at all unless offending vehicle is moved • Vehicles parked in bus stops prevent the bus pulling in close to the kerb negating the benefit of low floor vehicles
Enforcement • Illegal roadside parking • Illegal roadside deliveries • Blocking of bus stops • Illegal parking adjacent to bus stops • Illegal parking/delivery in bus lanes • Illegal use of bus lanes • Parking adjacent to speed cushions
Roadworks • Can have devastating effects on bus punctuality and reliability • Buses cannot deviate to avoid road closures, one way working or traffic signals • The Traffic Commissioners expect us to take compensating actions • The most vulnerable are affected
Roadworks – what can be done? • Active management of roadworks • Advanced warning of roadworks to bus operators • Coordination of roadworks by multiple contractors • Consideration of actions to minimise or mitigate delays, e.g. out of peak times • Consultation with bus operators on traffic management arrangements
Conclusions • Bus services can be made more attractive through improved journey times and reduced unpredictability • This would help operators to improve frequencies and reduce fares • This would enable us to help you to achieve modal shift • This will be much more effective with some demand restraint • These actions will help to achieve congestion and environmental targets