Download
1 / 15
200 likes | 562 Views
Inventory Management for Independent Demand. Chapter 12, Part 2. Presentation Outline. Independent demand inventory (continued) Fixed order quantity method (continued) Reorder point and reorder point with safety stock

E N D
Inventory Managementfor Independent Demand Chapter 12, Part 2
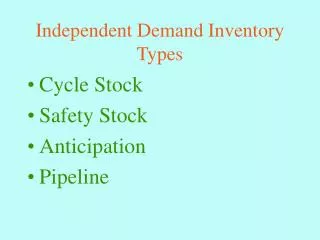
Presentation Outline • Independent demand inventory (continued) • Fixed order quantity method (continued) • Reorder point and reorder point with safety stock • Can be used with any fixed order quantity, including the economic order quantity • Production lot sizing: how much of a part or product should be made at one time? • Economic production quantity
Simple Reorder Point • Use this method when daily demand is constant. • R = reorder point • d = daily demand (may have to compute this) • L = lead time (Caution: if lead time is given in weeks, convert this to days). • R = dL
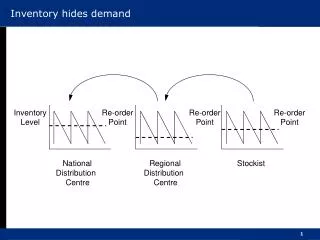
Reorder Point with Safety StockR = dL+SS • Safety stock (SS) is extra inventory that is kept to meet unexpected demand. Reorder point without safety stock Reorder point with safety stock
Reorder Point with Safety Stock (2)How much safety stock (SS) ? • Service level is the probability of having enough inventory to meet demand during lead time • The probability of a stockout is (1-service level) • Demand during lead time is normally distributed with mean dL and standard deviation sdL • z is the number of standard deviations required to meet the desired service level • SS = zsdL • Reorder point with safety stock: R = + zsdL
Reorder Point with Safety Stock (3)Example Given • D = annual demand = 10,000 • N = number of business days per year = 250 • The company operates 5 days per week • = average daily demand • s = standard deviation of demand during lead time = 20 • L = lead time = 1 week • Service level = 96% Find: reorder point with safety stock: R = + zsdL
Reorder Point with Safety Stock (4)Solving the Problem • If average daily demand ( ) is not given, compute it. Note: = D/N and D = = 10,000/250 = 40 • If the lead time is given in weeks or months, compute lead time in days. L = 1 week = 1(5) = 5 days Note: 1 week is the number of days per week that the company operates. This may be 5, 6, or 7.
Reorder Point with Safety Stock (5)Solving the Problem (2) • Find the z value for the service level (96%) Appendix B gives this area. Probability of a stockout = 1 – service level = 4% 50% 46% z
Reorder Point with Safety Stock (6)Solving the Problem (3) • Find the z value for the service level (96%) (cont.) (a) Write the service level as a decimal 96% = 0.9600 (b) Subtract 0.5000 from the service level 0.9600 – 0.5000 = 0.4600 (c) Use the table in Appendix B, page 650, to find the area that is closest to 0.9600 The closest area in the table is 0.4599, which occurs when z = 1.75 Use z = 1.75
Reorder Point with Safety Stock (6)Solving the Problem (4) • Compute R R = L+ zsdL = 40(5) + 1.75(20) = 200 + 35 = 235
Economic Production Quantity • Key question: How many units of a part or product should be made at one time? • The economic production quantity (EPQ) is the production quantity (lot size) that minimizes the total annual cost of setups and holding inventory.
Economic Production Quantity (2)Notation • Q = Amount to make (lot size) • D = annual demand for the item • d = daily demand for the item • p = daily production rate • S = cost of one setup • H = inventory holding cost per unit per year (commonly called holding cost) • TC = annual cost of setups + annual cost of holding inventory • The EPQ is the quantity that minimizes TC
Economic Production Quantity (3) Assumption: Daily demand < daily production. When the item is being made, some is sold or used to make a product. The remainder goes into inventory. When production stops, the inventory is used until there is no inventory left. Then production resumes. Ending inventory = beginning inventory + production - sales or usage
Economic Production Quantity (4) • Length of production run = Q/p • During production, d units are sold or used each day. (p – d) units go into inventory. Maximum inventory: Total cost: Economic production quantity (EPQ):
Economic Production Quantity (5) • When to use economic order quantity (EOQ): • Demand is independent • Compute how much to order (order quantity) • When to use economic production quantity (EPQ): • Parts or products will be produced – demand is dependent • Compute how much to make at one time (production lot size)