Download
1 / 24
240 likes | 268 Views
Brian A. Boecherer University of Connecticut October 26, 2009 ~ NACEP Memphis. The Allegory of the Cave: Using Data to Show the Realities of your CEP. This is a presentation mostly on methodology … I am not offended if you leave right now … First, we’ll discuss perceptions

E N D
Brian A. Boecherer University of Connecticut October 26, 2009 ~ NACEP Memphis The Allegory of the Cave: Using Data to Show the Realities of your CEP
This is a presentation mostly on methodology • … I am not offended if you leave right now … • First, we’ll discuss perceptions • Second, finding your sources of data • Third, presenting useful data • Fourth, asking for help • Let’s conclude with some discussion Overview
This presentation will focus on quantitative methods. But as you will see qualitative methods will not be absent the examples. Mixed methods are best. However, it often seems that qualitative is the only approach in CEP presentations… So, let’s start thinking Numbers! Quantitative versus Qualitative
Plato’s The Republic, Book VII Imagine a cave that holds prisoners… The prisoners are chained and can only stare at the wall… Behind them is a walkway or a stage… And behind that a huge fire… The prisoners can only see the shadows of those on the walkway… What is the Allegory of the Cave?
The problems with Assuming Normal Human? or Should I be worried? Nosferatu
Do people see reality? ? “Dog and his Shadow” TrekEarth
? “White Trash with Gills” by Tim Noble and Sue Webster
Do you know what people see and think about your program? • The stereotypes range from… • It’s a moneymaker for the University. • The Departments may think, you’re taking students out of our courses and costing the Dept. money. • Are these really quality courses? • How does the CEP represent the university? So, what is the point?
University Deans and Directors High School Faculty & Staff Parents Students Department of Education Other Public Organs – Media, Politicians, … Who’s in your audience?
How does your CEP benefit me? What are the costs to me? In addition to student success how else does this support my mission? What do they find interesting?
UConn Freshman English has a mandatory student enrollment cap of 20 Students per Section. 270 ECE Alumni matriculated into UConn in 2007 having taken UConn English through ECE – Requiring 14 Fewer Sections Departmental Appeal $19,800.11 Stipend, plus $10,442.00 In-State Tuition (not including Benefits) Average Savings $248,241.77 + $30,242.11 (In-State) per Student (per Two Sections) $19,800.11 Stipend, plus $20,884.00 Out-State Tuition (not including Benefits) + $40,684.11 (Out-State) per Student (per Two Sections)
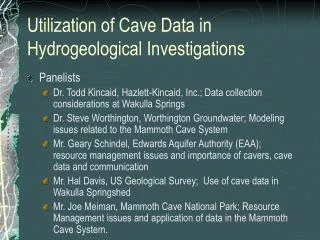
Getting your numbers is sometimes a challenge • You can count students, courses, etc. • You can invest in software that counts • Talk to colleagues outside your CEP • Academic Advising • Registrar • Technology Help Center Where do you get your numbers?
How are our CEP students designated in the student administrative system? • Do these students get university ID numbers? • Do your academic advisors have private databases you can use? • Access Databases, FileMaker, etc. What do you want to ask?
What do you do first, get the data or get your research questions? There are actually benefits to both. If you can get data easily, refine your questions first and then get the appropriate data. If you have data, assess the data and then see what questions you can answer with it. Benefits … concerns … Endogeny… wait, what’s that again?
Excel is useful for many data projects. • You may need to upgrade and learn to use: SAS, SPSS, or STATA. • These programs are good for regressions and huge data sources that will make Excel crash. • They are also very good for processing “unclean” data. • There are also programs to find the data – BRIO or Hyperion (talk to your registrar). Let’s talk data programs
Do not be limited by your own expertise. You work at a college or university – OUTSOURCE to the professionals! Remember the idea of unclean data? What’s your Stats Plateau?
Formulate your questions. Get as much data as possible. Sort through to see what’s of interest. Get an idea of what suits your constituents. Present what is meaningful. Conclusions
What is the point? • Promote your CEP with numbers. • Learn about your program and improve it. • Think big, your program is part of a NACEP movement – your success promotes all of our successes. • Do not stop at a presentation, try for publication (promotional or scholarly). • Use your network of NACEP colleagues. Conclusions
Discussion? Brian.Boecherer@uconn.edu