Download
1 / 41
410 likes | 614 Views
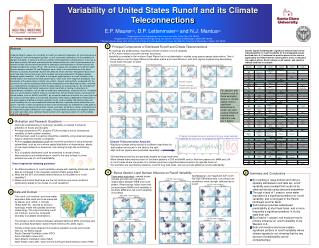
Aspects of Eastern United States Climate variability. Gerald Bell Climate Prediction Center NOAA/ NWS. Many issues related to climate variability Many temporal and spatial scales involved Analysis and interpretation issues Extratropical teleconnections North Atlantic Oscillation

E N D
Aspects of Eastern United States Climate variability Gerald Bell Climate Prediction Center NOAA/ NWS
Many issues related to climate variability • Many temporal and spatial scales involved • Analysis and interpretation issues • Extratropical teleconnections • North Atlantic Oscillation • Pacific/ North American (PNA) Pattern • Arctic Oscillation • Climate Links to Tropics • ENSO, • Tropical Multi-decadal Mode/ Trend • Combined influence of leading tropical modes • 5. Summary OUTLINE
Analysis and Interpretation • Depends on combination of factors • a. Analysis technique • Grid-point vs. EOF • Correlation vs covariance analysis • Rotated EOF vs non-rotated • b. Analysis region • Extratropics, tropics, both; • NH, SH or both
(Barnston and Livezey 1987) • Affects Atlantic jet stream/ storm track • Varies on multiple time scales North Atlantic Oscillation (NAO)Upper-Level Height, Wind Anomalies - + - + 1980’s- present 1950’s-1960’s
NAO: DJF Time Series 50 55 60 65 70 75 80 85 90 95 00 Negative: 1950’s-1960’s Stronger Hudson Bay Low More Arctic outbreaks Cooler Temperatures Positive: 1980’s-present Weaker Hudson Bay Low Arctic air confined to Canada Milder Temperatures
- + + - Pacific/ North American Pattern (PNA) Positive Phase Typical of El Nino Amplified subtropical ridge, Deeper Icelandic Low Eastward Extension of East Asian jet, Amplified ridge-trough pattern across United States
Tropical/ Northern Hemisphere PatternPositive Phase + - - - + Typical of La Nina
Arctic Oscillation: SLP - + + Zonally symmetric Sea-Level Pressure anomalies Combines aspects of NAO, PNA patterns
Climate Links to Tropics • Interannual:---ENSO (El Niño/ Southern Oscillation): • Multi-decadal/ trend— • Tropical multi-decadal mode: • Tropics-wide pattern linked to coherent multi-decadal fluctuations in tropical convection and surface temperatures—many regional aspects already published in literature
500-hPa jet core East Asian Jet Stream Subtropical jet stream DJF Climatology OLR, 200-hPa streamfunction 200-hPa Wind speed, streamfunction
ENSO SST(°C) and Anomaly 28 28 28oC is approximate threshold for deep tropical convection
ENSO Tropical Rainfall EL Niño Enhanced Convection La Niña suppressed convection El Niño: Tropical convection, jet stream extended eastward La Niña: Tropical convection, jet stream retracted westward
No Blocking Subtropical ridge, jet extend eastward Jet exit region (cyclogenesis) upstream of Calif. OLR, 200-hPa streamfunction 1998: January-March Strong El Nino 200-hPa Wind speed, streamfunction More zonal flow over U.S.
Jet and Subtropical ridge retracted westward High-Latitude Blocking Jet exit region West of dateline Strong Mid- Pacific Troughs La Nina: 200-hPa Circulation-DJF 1988-89 Circulation features retracted westward with tropical convection
El Niño Temperature Impacts DJF: # Days Above +5C More very warm days Fewer very warm days DJF: # Nights Below –5C Fewer very Cold nights
La Nina mean –neutral mean El Nino mean –neutral mean Nov-Mar: ENSO Precipitation Events > 0.5 inches Neutral Year Mean
El Nino mean –neutral mean Nov-Mar Snowfall (inches) Less Snow More Snow La Nina mean –neutral mean
El Niño: • Extended Jet Stream • More zonal flow over U.S. • South shift of storm track • Weaker Hudson Bay Low • Fewer arctic outbreaks • La Niña: • Retracted Jet Stream • More meridional flow • Blocking over N. Pac • Stronger Hudson Bay Low • More arctic outbreaks ENSO Schematic
Combined Climate Impacts • El Niño impacts can vary depending on • Internal variability: PNA, NAO, AO • Background flow: decadal/ trend • Combination of ENSO + decadal signals is key to understanding climate variability and improving seasonal predictions
El Niño’s Negative NAO: Cooler over SE, Mid-Atlantic, NE Positive NAO: Warmer over SE, Mid-Atlantic, NE oC El Niño – NAOTemperature Composites
Coherent Global- scale Variabilityon Multi-decadal time scales SST: Mestas-Nuñez and Enfield (1999) Livezey and Smith (1999), Gray et al. (1997) Tropical rainfall: Pacific: Morrissey and Graham (1996) Amazon Basin: Chu et al. (1994), Chen et al. (2001) West Africa: Folland et al. (1986), Nicholson and Palao (1993) Atlantic hurricanes: Landsea and Gray (1992), Goldenberg et al. (2001) PDO: Trenberth and Hurrell (1994), Latif et al. (1997) NAO: Halpert and Bell (1996), Hurrell (1998) Indian Ocean/ NAO: Hoerling et al. (2001), Kawamura (1994) Tropical Multi-decadal Mode: Chelliah and Bell (2003)
TROPICAL MULTI-DECADAL MODE • Defined by leading multi-decadal EOFs of tropical convection and surface temperature variability • Leading mode of decadal variability in NCEP/ NCAR Reanalysis. • Captures the multi-decadal variability just mentioned • Provides global-scale perspective on decadal climate variability already described in the literature
200-hPa Velocity Potential Loadings: DJF PC Time Series ENSO TMM Tropical Multi-decadal Mode (Positive Phase) ENSO (El Niño) Explained Variance
Tropical Multi-Decadal Mode DJF: Positive Phase (1980s-1990s) Cooler Cooler Cooler Warmer Warmer Warmer Surface Temperatures Precipitation Weaker Tropical Easterly Jet Drier Wetter Wetter Wetter Stronger Easterly Trades Drier
Area-Averaged Circulation Anomalies North Pacific Subtropical Ridge East Asian Jet in Exit Region Stronger Stronger ENSO ENSO Weaker Weaker Tropical Multi-Decadal Mode Tropical Multi-Decadal Mode Over North Pacific strongest combined signal occurs when the two tropical modes are in phase Strongest ridge and jet stream: El Nino + Positive TMM Weakest ridge and jet stream: La Nina + Negative TMM
Regressed Area-Averaged Circulation Anomalies Atlantic Multi-Decadal Mode North Atlantic Oscillation (NAO) Warmer Negative ENSO ENSO Colder Positive Tropical Multi-Decadal Mode Tropical Multi-Decadal Mode Over North Atlantic strongest combined signal when the two tropical modes are out of phase: Most Positive NAO occurs for La Nina + Positive TMM Most Negative NAO occurs for El Nino + Negative TMM
DJF Regressed Temperature Anomalies Positive Phase of Tropical multi-decadal mode Strong Decadal Signal Alaska Canada Central Plains Southwest El Nino
DJF Regressed Temperature Anomalies: Combined Modes Positive TMM and El Nino Negative TMM and El Nino
DJF Regressed Temperature:Combined Modes Negative TMM and La Nina Positive TMM and La Nina
Tropical Multi-Decadal Mode JJA Positive Phase: 1980s-1990s Surface Temperatures Cool Cooler Cool Cool Warm Warm Warm Warm Precipitation Wet Dry Wet Wet Dry Weaker Tropical Easterly Jet Stronger Easterly Trades
Tropical multi-decadal mode: JJAPositive Phase: 1980s-1990s Regressed 200-hPa Streamfunction, V-total Regressed 200-hPa, Divergence, V-Div
Combined TMM and ENSO: JJAExplained seasonal precipitation rate variance
Positive TMM and El Nino JJA Precipitation Rates: Combined Modes Large Decadal Signal: Southwestern U.S./ Western Mexico Midwest Gulf Coast/ Atlantic Seaboard Negative TMM and El Nino
Positive TMM and El Nino JJA Temperature: Combined Modes Large Decadal Signal Negative TMM and El Nino
Landfalling Hurricanes First Named in Main Development Region and Reaching Major Hurricane Strength Active 24-Year Period 1955-1970, 1995-2002 Inactive 24-Year Period 1971-1994 15 Make Landfall as Hurricanes All hit as Major Hurricanes 42 Make Landfall as Hurricanes 31 Hit as Major Hurricanes
Summary • N.A. climate variability linked to fluctuations in tropical rainfall on interannual and multi-decadal time scales • Interannual:---ENSO (El Niño/ Southern Oscillation): • Winter: East Asian jet, N.A. circulation • El Nino • Eastward extension of East Asian jet stream • Southward shift of jet core/ storm track from Washington State to California • La Nina • Westward retraction of circulation features • Blocking over high latitudes of North Pacific • ENSO signal over eastern N. A. modulated by NAO
Tropical multi-decadal mode (TMM): Global-scale perspective on decadal variability in literature • Captures global climate regimes of 1950s-1960s and 1980s-1990s, and 1970’s transition. • Links multi-decadal variations in East-Asian jet stream, NAO, Atlantic hurricane activity, Atlantic multi-decadal mode, Indian Ocean warming, etc. • Four core tropical regions: West Africa, central tropical Pacific, Amazon Basin, tropical Indian Ocean. • Strongest combined signal with ENSO: • North Pacific, tropical North Atlantic when in phase • Extratropical North Atlantic, NAO when out of phase Summary