Download
1 / 20
200 likes | 288 Views
Cost of Capital. Identify Industry and Comparable Companies. Are there other public companies in the industry? Are there public companies with similar characteristics? Determine average equity beta for comparable companies. Determine % of equity for comparable companies.

E N D
Identify Industry and Comparable Companies • Are there other public companies in the industry? • Are there public companies with similar characteristics? • Determine average equity beta for comparable companies. • Determine % of equity for comparable companies.
Boston Celtics: Comparable Companies • There are no other publicly owned professional basketball franchises. Sports franchises. • What are key economic drivers?
Boston Celtics: Comparable Companies • There are no other publicly owned professional basketball franchises. Sports franchises. • What are key economic drivers? • Team performance.
Boston Celtics: Comparable Companies • There are no other publicly owned professional basketball franchises. Sports franchises. • What are key economic drivers? • Team performance. • Popularity of Basketball as a sport.
Boston Celtics: Comparable Companies • There are no other publicly owned professional basketball franchises. Sports franchises. • What are key economic drivers? • Team performance. • Popularity of Basketball as a sport. • Disposable income of fans. • Similar to other entertainment companies
Identify Industry and Comparable Companies • Are there other public companies in the industry? • Are there public companies with similar characteristics? • Determine average equity beta for comparable companies. • Determine % of equity for comparable companies.
Comparable Companies Company Eq. Beta LTD to BV Assets Capital Cities Comm. .93 43.2% Chris-Craft .68 42.3% Taft Broadcasting .82 64.3% United Cable .95 82.7% Viacom Int’l .69 46.9% Average .814 55.9%
Impact of Financial Leverage Published betas for publicly traded stock reflect the actual capital structure of each respective company. As such they can be referred to as levered betas. An unlevered beta is the beta the company would have if the company’s assets were 100% financed with equity (e.g., it had no debt).
Levered Beta toUnlevered Beta BL Bu = 1 + (1 - t) Wd / We Bu = Unlevered Beta BL = Levered Beta (published) t = tax rate for the company Wd = Percent debt in the capital structure We = Percent equity in the capital structure
Unlevered Beta to Levered Beta BL = Bu (1 + (1 - t) Wd / We) BL = Levered Beta (calculated) Bu = Unlevered Beta t = tax rate for the company Wd = Percent debt in the capital structure We = Percent equity in the capital structure
Comparable Companies Company Eq. Beta LTD to BV Assets Unlevered Beta Capital Cities Comm. .93 43.2% .619 Chris-Craft .68 42.3% .458 Taft Broadcasting .82 64.3% .375 United Cable .95 82.7% .229 Viacom Int’l .69 46.9% .436 Average .814 55.9% .443
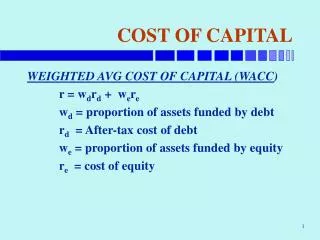
Cost of Capital rE = rF + beta ( E(rM) - rF)
Cost of Equity Capital rE = rF + beta ( E(rM) - rF) Cost of Equity = Risk Free Rate + (Beta x Risk Premium) 1986 Cost of Equity = 7.65% + ( .443 x 7.60% )
Cost of Capital Cost of Capital = Risk Free Rate + (BetaUnlevered x Risk Premium) 1986 C of C = 7.65% + ( .443 x 7.6% ) = 11.02% T. Bond (30 Year) Previous Calc. Empirical Average 1926 - 1993
Determine Present Value of Cash Flows Present Value of a stream of cash flows (using MS Excel) =NPV (Discount rate, cash flow yr. 1, cash flow yr. 2, ….) Present Value of Cash Flow for Terminal Year Cash Flow for Terminal Year Discount Rate ( 1 + Discount Rate) Number of years out
Boston Celtics: Firm Value Value of Equity = Discounted Cash Flows
Present Value of First Five Year’s Cash Flows Look up how to determine a series of cash flows in MS Excel. Use the same discount rate for each year of the series.
Present Value of Terminal Year Cash Flow in Terminal Year Discount Rate (1 + Discount Rate) n n = number of years out for the terminal year
Terminal Year Alternatives • Do you forecast growth in sales in the terminal year?