Download
1 / 28
300 likes | 538 Views
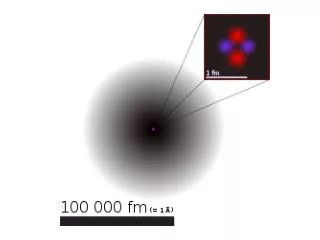
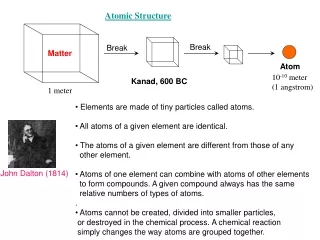
Atomic Structure. Relative masses/charges of protons, neutrons and electrons. Isotopes. Isotopes are atoms of the same element with the same ________(same number of protons) but different __________(different no. of neutrons). Pg 57 Test yourself. Isotopes.

E N D
Isotopes • Isotopes are atoms of the same element with the same ________(same number of protons) but different __________(different no. of neutrons). Pg 57 Test yourself
Isotopes • react the same way (same chemical properties) N2 + 3H2 2NH3 N2 + 3D2 2ND3 • have different physical properties has a boiling pt of -2530C whereas has a boiling pt of -2500C Chemical properties – the same number and arrangement of electrons Why? Physical properties – different masses hence move at diferent speed
Radioactive Isotopes • Many isotopes are radioactive as the nuclei of these atoms break down spontaneously, emitting radiation. • 3 different forms of radiation • Gamma radiation : highly penetrating • Alpha radiaton : can be stopped by a few cm of air • Beta radiation : can be stopped by a thin sheet of aluminium.
Radioactive Isotopes • nuclear power generation • sterilization of surgical instruments in hospitals • crime prevention • finding cracks and stress in metals and • preservation of food
Carbon Dating • By measuring the relative isotopic mass of C-14 in a given organic – possible to calculate the age of a living organism from the % of C-14 remaining in the sample. (how decay and half life).
The mass spectrometer Positive ions are accelerated in an electric field. Atoms/molecules are bombarded by high energy electron. Atoms are ionised by knocking one or more electrons off to give a positive ion. M(g) + e M+(g) + 2e Ions are deflected by a magnetic field. The beam of ions is detected electrically http://www.chemguide.co.uk/analysis/masspec/howitworks.html
Heaviest ions Lightest ions • Different ions are deflected by the magnetic field by different amounts. • The amount of deflection depends on: • the mass • positive charge on the ion. Lighter ions are deflected more than heavier ones. Ions with 2 (or more) positive charges are deflected more than ones with only 1 positive charge. The lower the mass/charge (m/z) ratio, the more the ions are deflected
The mass spectrometer measures the relative abundance of different isotopes (atoms) of an element. The output is a mass spectrum. The mass spectrum shows that iron has 4 isotopes as follows: Calculate the relative atomic mass of iron. Pg 61 Test yourself
An element has an atomic number of 24. The natural element consists of four isotopes. The mass spectrum of the element X produced the following peaks of three of its isotopes on the chart recorder. • What is element X classified in the Periodic Table? • Calculate the isotopic mass of the 4th isotope if the relative atomic mass of element X is 52.06.
Bohr Model • In 1913, Neils Bohr proposed that the electrons in atoms are a in orbits of differing energy around the nucleus (think of planets orbiting around the sun
Bohr Model • Electron can gain energy by moving to a higher energy level or • lose energy by moving to lower energy level • Transitions of electrons between two discrete energy levels will produce a line spectrum. • Line spectrum – evidence for electrons being in energy levels (shells).
Emission Spectrum • An electron in a higher energy level • (larger value of n) would fall into a • lower energy (stable). • This process would involve a loss of • energy. • To conserve energy, a particle called a • photon carries away the excess • energy in this transition. • The energy of this photon • = difference in the energy levels of the electron transition ( E2 – E1 ) • To identify this photon with the light found when atoms emit light,we need to know the frequency of the emitted light. • Energy = h x frequency h : Planck's constant
For a given atom, there can be many types of transitions from higher to lower energies, and thus many different energies of emitted photons and, subsequently, many different frequencies of light waves.
When electrons return to the first level (n = 1) the series of lines occurs in the ultraviolet region (Lyman series )as this involves the largest energy change. • The visible region (Balmer series )spectrum is formed by electrons dropping back to the n = 2 level and the first series in the infrared (Paschen series) is due to electrons falling to the n = 3 level. The lines in the spetrum converge because the energy levels themselves converge. Page 56
Such series of distinct spectral lines are observed experimentally when a gas such as hydrogen is heated up – the added heat energy excites the electrons, which subsequently fall into lower energy levels, emitting photons of various energies and, thus, light of various frequencies. • The observed frequencies correspond very well to what is predicted in the Bohr model.
Line Spectrum • When energy is supplied to individual elements they emit a spectrum which only contains emssions at particular wavelengths. • Each element has its own characteristic spectrum known as a line spectrum.
The visible hydrogen spectrum • The spectrum consists of discrete lines and that the lines converges towards the high energy (violet) end of the spectrum. Energy = h x frequency Energy = h x speed of light / wavelength The lines in the spectrum get closer together at higher frequency / energy Page 63
Continuous Spectrum White light is made up of all the colours of the spectrum. When it is passed through a prism, a continuous spectrum of all the colours can be obtained. A continuous spectrum contains all wavelengths from a band of the electromagnetic spectrum.
Electron Arrangements • Electrons in an atom are arranged in energy levels(shells). • Max no. of electrons in each shell = 2n2
The energy levels are called shells with numbered 1, 2, 3, 4, etc. (principal quantum numbers, n) • n correspond to the no. of rows (periods) in the PT. • For a given element, electrons are added to the shells as follows: • Up to 2 electrons in shell 1 • Up to 8 electrons in shell 2 • Up to 18 electrons in shell 3
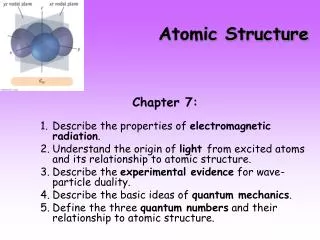
Sublevel designation n = 4 4s 4p 4d 4f n = 3 3s n = 2 3p 3d 2s 2p 1s n = 1 Modern Atomic Structure An orbital for a hydrogen atom. The intensity of the dots shows that the electron spends more time closer to the nucleus. The first four principal energy levels in the hydrogen atom. Each level is assigned a principal quantum number n. The types of orbitals on each of the first four principal energy levels. Hein, Arena, Foundations of College Chemistry, 2000, page 202
Energy Level Diagram of a Many-Electron Atom 6s 6p 5d 4f 32 5s 5p 4d 18 4s 4p 3d 18 Arbitrary Energy Scale 3s 3p 8 2s 2p 8 1s 2 NUCLEUS O’Connor, Davis, MacNab, McClellan, CHEMISTRY Experiments and Principles 1982, page 177