Download
1 / 30
420 likes | 974 Views
Metallic Materials-Phase Diagrams. Engineering Alloys

E N D
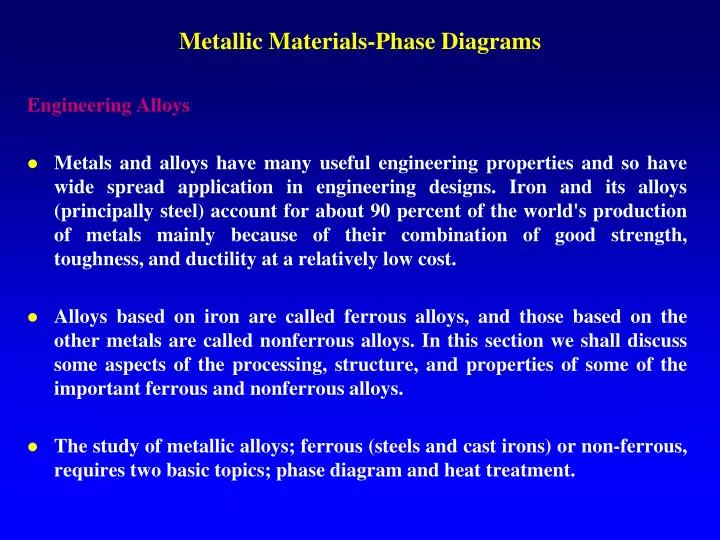
Metallic Materials-Phase Diagrams Engineering Alloys • Metals and alloys have many useful engineering properties and so have wide spread application in engineering designs. Iron and its alloys (principally steel) account for about 90 percent of the world's production of metals mainly because of their combination of good strength, toughness, and ductility at a relatively low cost. • Alloys based on iron are called ferrous alloys, and those based on the other metals are called nonferrous alloys. In this section we shall discuss some aspects of the processing, structure, and properties of some of the important ferrous and nonferrous alloys. • The study of metallic alloys; ferrous (steels and cast irons) or non-ferrous, requires two basic topics; phase diagram and heat treatment.
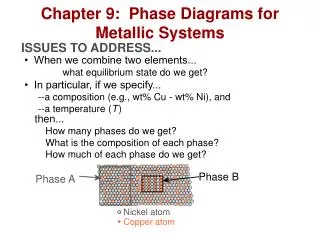
Metallic Materials-Phase Diagrams • Temperature vs. composition behavior of the various alloy constitutes the phases. • Allows design and control of heat treatment by controlling equilibrium and non-equilibrium structure. • Structure (phases and microstructure) often controls properties of materials, and, therefore, depends on thermal history. • Objectives: • Read and evaluate phases present at T. • Determine composition of phases and phase fraction. • Know eutectic, eutectoid and proeutectoid reactions. • Make a schematic diagram of microstructure.
Metallic Materials-Phase Diagrams Components: elements or compounds that are mixed (e.g., Al and Cu) Phases: physically and chemically distinct material regions. Aluminum-Copper Alloy Solid-solution Phase Ordered Phase
Metallic Materials-Phase Diagrams • A solution of two materials involves one material (solute) directly combined with another material (solvent) without changing the structural pattern of the solvent. They can involve substitution of atoms into the structure or placement of interstitial atoms in the structure. • Some metal solutions have a continuum of ratios between the solute and solvent so that materials can consist of between 0 and 100 wt% of either. • Solution based alloys are typically stronger than pure materials as the solute atoms interfere with the movement of dislocations (solution hardening). • Mixtures: A mixture of two materials involves the combination of two different structures of material without affecting either individual structure.
Metallic Materials-Phase Diagrams • Phase Diagrams describe the coexistence of phases of a material over a range of temperatures and compositions. • Can be used to determine (for a given temperature and composition) • The stable phases of the material • The chemical compositions of the phases • The quantity of each phase present under equilibrium conditions • Each phase will have different properties at different compositions. • Each mixture will have different properties at different quantities of each phase. • The properties of a phase or mixture will also vary with temperature
Metallic Materials-Phase Diagrams To determine the composition of the phases present: For a solution: Composition of a solution is the same as the overall composition of the material For a mixture : Trace horizontal line across isotherm (temperature line) to each edge of region • Drop vertical line down to determine the composition of the phase (in terms of component materials) at that temperature • Composition of each phase of mixture is that of phase alone at the that temperature where it transitions between existing as a pure solution and existing as part of a mixture To determine the amount of each phase present (mass fraction): • For a solutions : are composed of 100 percent of the single phase • For mixtures: Perform a materials balance (inverse lever rule). • Percent alpha = (C-beta - C-x)/(C-beta - C-alpha) • C-x is the composition of the phase or mixture (x) in terms of one of the two component materials (i.e. Amount of lead in alpha, beta, and the total material) • Percent beta = 1 - percent alpha .
Metallic Materials-Phase Diagrams 1st type phase Diagrams Cu-Ni Phase Diagram • Rule 1: If we know T and Co • Number of phases • Composition of each phase • Amount of each phase • Examples: Number of Phases
Metallic Materials-Phase Diagrams Composition of phases Cu-Ni Phase Diagram Amounts of phases = 27%
Metallic Materials-Phase Diagrams Lever Rule: wt. fraction of phases • Sum of weight fractions: • Conservation of mass (Ni): • Combine above equations: • A geometric interpretation:
Metallic Materials-Phase Diagrams Cooling in Cu-Ni Binary System • Consider Co = 35wt%Ni.
Metallic Materials-Phase Diagrams • Ca changes as we solidify. • Cu-Ni case: First a to solidify has Ca = 46wt%Ni. Last a to solidify has Ca = 35wt%Ni. • Fast rate of cooling: Cored structure • Slow rate of cooling: Equilibrium structure
Metallic Materials-Phase Diagrams Cu-Ni Phases and Microstructure (non-equilibrium) • Upon cooling more quickly (i.e. non-equilibrium), microstructure has range of composition depending on when it was formed. • Inside nucleus of solid phase higher composition (in Cu-Ni case) due to its creation at higher T. • Outside part of growing solid phase nucleus has lower composition due to its forming at lower T.
Metallic Materials-Phase Diagrams Mechanical Properties of Cu-Ni • Effect of solid solution strengthening on: --Ductility (%EL,%AR) --Tensile strength (TS) Adapted from Fig. 9.5(a), Callister 6e. Adapted from Fig. 9.5(b), Callister 6e. -Peak as a function of Co -Minimum as a function of Co
Metallic Materials-Phase Diagrams 2ed type phase Diagrams Binary-Eutectic Systems • Ex: Cu-Ag • 3 single-phase regions • (L, , ) • Limited solubility • : mostly Cu • : mostly Ag • TE: no liquid below TE. • cE: composition for min. melting T. Eutectic: L +
Metallic Materials-Phase Diagrams Microstructure for Pb-Sn Eutectic Diagram • Co < 2wt%Sn • Polycrystal of a grains. • 2wt%Sn < Co < 18.3wt%Sn • a polycrystal with fine b crystals. Adapted from Fig. 9.9 and 9.10, Callister 6e.
Metallic Materials-Phase Diagrams Microstructure at Eutectic Light: Sn-rich Dark: Pb-rich Pb-Sn system Adapted from Fig. 9.12, Callister 6e. Adapted from Fig. 9.11, Callister 6e.
% % % % Metallic Materials-Phase Diagrams Pb-Sn system • 18.3wt%Sn < Co < 61.9wt%Sn • Result:a crystals and a eutectic microstructure Adapted from Fig. 9.14, Callister 6e.
Metallic Materials-Phase Diagrams Solder: Lead-Tin (Pb-Sn) microstructure • For 50 wt% Pb alloy: • Lead-rich phase (dark) • Lamellar eutectic structure • of Sn-rich phase (light). * Why is Liquid-phase ~62.9wt%Sn and -phase ~16.3wt%Sn at 180 C? * For fraction of total phase (both eutectic and primary), use the Lever Rule.
Hypoeutectic & Hypereutectic Metallic Materials-Phase Diagrams Fig. 10.12 Fig. 10.15 Adapted from Fig. 10.15, (Illustration only) Adapted from Fig. 9.7, Callister 6e.
Metallic Materials-Phase Diagrams • Example Problems • For a 40wt%Sn-60wt%Pb alloy at 150C, find... • the phases present: • a + b • the compositions of • the phases: Lead-Tin (Pb-Sn) Eutectic Diagram Solder for electronics 14
Metallic Materials-Phase Diagrams Answer: For a 40wt%Sn-60wt%Pb alloy at 150C, find... - phases present: a + b - compositions of phases: Ca = 11wt%Sn Cb = 99wt%Sn - relative amounts (fractions) of each phase: Lead-Tin (Pb-Sn) Eutectic Diagram W = 59/88 = 67% W = 29/88 = 33% Adapted from Fig. 9.7, Callister 6e.
Metallic Materials-Phase Diagrams Problems Examples Fig 1
Metallic Materials-Phase Diagrams Problems Examples With reference to Fig. 1, answer the following questions: (Questions 1-7) • The amount of α in comparison with β (amount of α: amount of β) that forms if a 90%Pb-10%Sn alloy is cooled to 0 C is (a). 45:4 (b) 4:45 (c) 8: 98 (d) 98:8 • The compositions of α and β phases at 170 C are … respectively (a) 98.5% Pb and 11% Pb (b) 98.5% Sn and 11% Sn (c) 11%Pb and 98.5% Sn (d) None of the above • The amounts of α and β phases that form if the 30%Sn-70%Pb alloy is cooled to 0C are ……. respectively. (a) 100 α and 0% β (b) 71.5% α and 28.5 β (c) 0 α and 100% β (d) 28.5% α and 71.5% β • The amount of primary α relative to the amount of eutectic for a 30%Sn-70%Pb alloy when it has been cooled to 0 C is (a)25% α (b) 75% β (c) 25% β (d) 75% α • For Pb-Sn alloy contains 45% Sn, which phases are in equilibrium at 100° C. What is the relative amount of each phase? • For Pb-Sn alloy contains 15% Sn, what phases, compositions and amounts are present at 182° C, 150° C, and 50° C.
Metallic Materials-Phase Diagrams Iron-Carbon (Fe-C) Phase Diagram Fig. 10.21 Fig. 10.24 Eutectoid: from solid phase to 2-phase solid upon cooling: + Fe3C 21
Hypoeutectoid Steel Metallic Materials-Phase Diagrams Fig. 10.27 From Figs. 9.21 and 9.26,Callister 6e.
Metallic Materials-Phase Diagrams Hypereutectoid Steel Adapted from Fig. 9.30,Callister 6e. Adapted from Figs. 9.21 and 9.29,Callister 6e.
Alloying Steel With More Elements Metallic Materials-Phase Diagrams • Teutectoid changes: • Ceutectoid changes: Adapted from Fig. 9.31,Callister 6e. Adapted from Fig. 9.32,Callister 6e.
Problems Examples Metallic Materials-Phase Diagrams
Problems Examples Metallic Materials-Phase Diagrams With reference to Fig. 2, answer the following questions: • Use the following iron-carbon diagram to determine the microstructure (phases present and the percent of each phase) for the following carbon-steel alloys (1-4): • 0.15 % C after air cooling to room temperature • 0.45% C after air cooling to room temperature • O.83 % C after air cooling to room temperature, and 8000C • 1.2 % C after air cooling to room temperature. • For an alloy containing 0.12%C, answer questions (5-6) • The alloy is designated….. … (low C - medium C - high C) steel. • This alloy contains ferrite and pearlite % at temperature below 700°C. • The alloy contains ferrite and cementite % at temperature below 700°C. • Sketch the cooling curve and microstructure for alloys A(pretectic), E(eutectoid), B(hyper-eutectoid) and Eutectic • The number of phases and relative amounts of each phase for the alloys containing 0.2,0.4 0.8% and 1 % carbon, at 1600, 950, 700, and after equilibrium cooling to room temperature. • The structure of the alloys containing 0.2,0.4 0.8% and 1 % carbon at RT.
start end Metallic Materials-Phase Diagrams Self-Assessment: Phases and Composition A Ni-50wt%Cu alloy is slowlycooled from 1400 C to 1200 C. At what temperature does the first solid phase form? What is the composition of the solid phase? At what T does the liquid solidify? What is the composition of the last remaining liquid?