Download
1 / 25
250 likes | 510 Views
Overview of Lecture. Testing the Null Hypothesis Statistical Power On What Does Power Depend? Measures of Effect Size Calculating Effect Size Reporting Effect Size What to Avoid. Making a decision . With F-ratios that exceed F-critical we reject the null hypothesis.

E N D
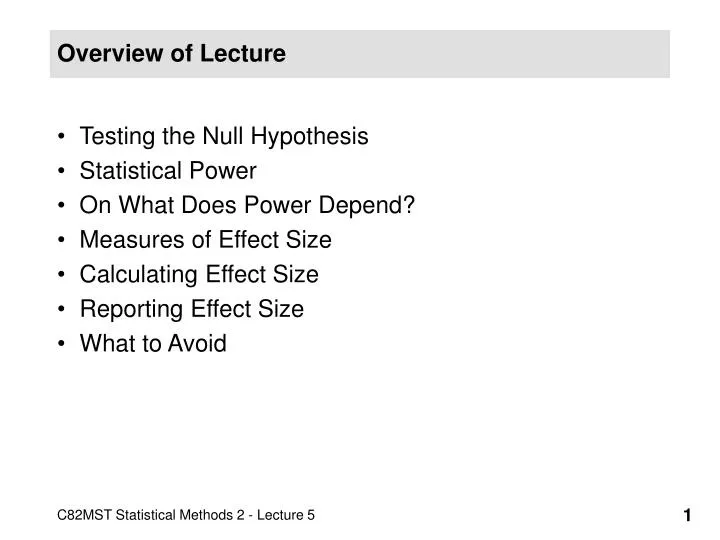
Overview of Lecture • Testing the Null Hypothesis • Statistical Power • On What Does Power Depend? • Measures of Effect Size • Calculating Effect Size • Reporting Effect Size • What to Avoid
Making a decision • With F-ratios that exceed F-critical we reject the null hypothesis. • independent variable(s) influence(s) the dependent variable. • Statistically significant effect. • When a finding does not exceed alpha level (p <0.05) we fail to reject the null hypothesis: • Ho=all means are equal implies no evidence of an effect of the treatment • No evidence of a statistical difference.
Failing to reject the null hypothesis • However, “no statistical difference” does not prove the null hypothesis. • We simply do not have evidence to reject it. • A failure to find a significant effect does not necessarily mean the means are equal. • So it is difficult to have confidence in the null hypothesis: • Perhaps an effect exists, but our data is too noisy to demonstrate it.
Statistical Power • Sometimes we will incorrectly fail to reject the null hypothesis – a type II error. • There really is an effect but we did not find it • Statistical power is the probability of detecting a real effect • More formally, power is given by: 1- where is the probability of making a type II error • In other words, it is the probability of not making a type II error
What does power depend on? • Power is your ability to find a difference when a real difference exists. The power of a study is determined by three factors: • Alpha level. • Sample size. • Effect size: • Association between DV and IV • Separation of Means relative to error variance.
Power and alpha • By making alpha less strict, we can increase power.(e.g. p < 0.05 instead of 0.01) • However, we increase the chance of a Type I error.
Power and sample size • Low N’s have very little power. • Power saturates with many subjects.
Power and Sample Size • One of the most useful aspects of power analysis is the estimation of the sample size required for a particular study • Too small an effect size and an effect may be missed • Too large an effect size too expensive a study • Different formulae/tables for calculating sample size are required according to experimental design
Power and effect size • As the separation between two means increases the power also increases
Power and effect size • As the variability about a mean decreases power also increases
Measures of effect size for ANOVA • Measures of association • Eta-squared (2) • R-squared (R2) • Omega-squared (2) • Measures of difference • d • f
Measures of association - Eta-Squared • Eta squared is the proportion of the total variance that is attributed to an effect. • Partial eta-squared is the proportion of the effect + error variance that is attributable to the effect • Both kinds are measures of association for the sample
Measures of association - R-Squared • In general R2 is the proportion of variance explained by the model • Each anova can be thought of as a regression-like model in which each IV and interaction between Ivs can be thought of as a predictor variable • In general R2 is given by
Measures of association - Omega-squared • Omega-squared is an estimate of the dependent variable population variability accounted for by the independent variable. • For a one-way between groups design: • Where, p=number of levels of the treatment variable and n= the number of participants per treatment level
Measures of difference - d • When there are only two groups d is the standardised difference between the two groups
Measures of difference - f • Cohen’s (1988) f for the one-way between groups analysis of variance can be calculated as follows • It is an averaged standardised difference between the 3 or more levels of the IV (even though the above formula doesn’t look like that) • Small effect - f=0.10; Medium effect - f=0.25; Large effect - f=0.40
Using Power Analysis to Calculate Sample Size • A simple power analysis program available on the web called GPower is available for download from the following address: • http://www.psycho.uni-duesseldorf.de/aap/projects/gpower/ • This program can be used to calculate the sample size required for different effect sizes and specific levels of statistical power for a variety of different tests and designs. • There are excellent help files available on the website
Estimating Effect Size • There are two ways to decide what effect size is being aimed for: • On the basis of previous research • Meta-Analysis: Reviewing the previous literature and calculating the previously observed effect size (in the same and/or similar situations) • On the basis of theoretical importance • Deciding whether a small, medium or large effect is required. • The former strategy is preferable but the latter strategy may be the only available strategy.
Calculating f on the basis of previous research • This example is based on a study by Foa, Rothbaum, Riggs, and Murdock (1991, Journal of Counseling and Clinical Psychology). • The subjects were 48 trauma victims who were randomly assigned to one of four groups. The four groups were • 1) Stress Inoculation Therapy (SIT) in which subjects were taught a variety of coping skills; • 2) Prolonged Exposure (PE) in which subjects went over the traumatic event in their mind repeatedly for seven sessions; • 3) Supportive Counseling (SC) which was a standard therapy control group • 4) a Waiting List (WL) control. • The dependent variable was PTSD Severity
Anova on example data • Give the above analysis • So
Number of participants required to replicate results • Give GPower the following values • Alpha=0.05 • 1-Beta=0.80 • f=0.378 • Then the total number of participants required is 84 (i.e. 21 participants per group) • Give GPower the following values • Alpha=0.05 • 1-Beta=0.95 • f=0.378 • Then the total number of participants required is 128 (i.e. 32 participants per group)
Estimating Sample Size For Small, Medium and Large Effects • Small Effect • Give GPower the following values • Alpha=0.05 • 1-Beta=0.80 • f=0.100 • Then the total number of participants required is 1096 (i.e. 274 participants per group) • Medium Effect • Give GPower the following values • Alpha=0.05 • 1-Beta=0.80 • f=0.250 • Then the total number of participants required is 180 (i.e. 45 participants per group) • Large Effect • Give GPower the following values • Alpha=0.05 • 1-Beta=0.80 • f=0.400 • Then the total number of participants required is 76 (i.e. 19 participants per group)
What should we report? • Practically any effect size measure is better than none particularly when there is a non-significant result • SPSS provides some measures of effect size (though not f) • Meta-analysis (e.g. the estimation of effect sizes over several trials) requires effect size measures • Calculating sample sizes for future studies requires effect size information
Things to be avoided….if possible • “Canned” effect sizes • The degree of measurement accuracy is ignored by using fixed estimates of effect size • Retrospective justification • Saying that a non-significant result means there is no effect because the power was high • Saying that there is a non-significant result because the statistical power was low