Download
1 / 115
1.15k likes | 1.17k Views
Overview of lecture. Acquisition of Data Measures of ground motion Processing of Data Properties of Data from Observations Data distribution in M-D space Path dependence of ground motion Magnitude dependence of ground motion Site dependence of ground motion. MEASURING EARTHQUAKES.

E N D
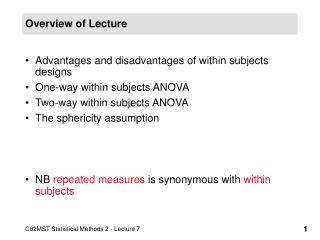
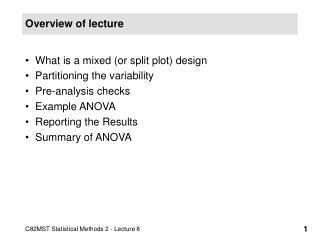
Overview of lecture • Acquisition of Data • Measures of ground motion • Processing of Data • Properties of Data from Observations • Data distribution in M-D space • Path dependence of ground motion • Magnitude dependence of ground motion • Site dependence of ground motion
MEASURING EARTHQUAKES The first known instrument for earthquakes measurement is the Chang seismoscope built in China in 132 B.C. Balls were held in the dragons’ mouths by lever devices connected to an internal pendulum. The direction of the epicenter was reputed to be indicated by the first ball released.
Jargon seismoscope – an instrument that documents the occurrence of ground motion (but does not record it over time) seismometer – an instrument that senses ground motion and converts the motion into some form of signal accelerometer – a seismometer that records acceleration, also known as strong ground motion geophone – another name for a seismometer, commonly used in active source seismology
More Jargon seismograph – a system of instruments that detects and records ground motion as a function of time seismogram – the actual record of ground motion produce by a seismograph seismometry – the design and development of seismic recording systems data logger – device that converts analog to digital signal and stores the signal
How Seismometers Work Fundamental Idea: To record ground motion a seismometer must be decoupled from the ground. If the seismometer moves with the ground then no motion will be recorded.
Strong-Motion Accelerographs Analog
Magnification curves Not shown: broadband (0.02—DC sec)
The nature of the seismogram and the waves shown depends directly on the type of seismograph
It is easier to make a stable, small short-period oscillator than a long-period oscillator. Note that modern strong-motion sensors use force-balance accelerometers with resonant frequencies near 50 Hz, where the quantity being measured is the current in a coil required to keep the mass centered. This current is proportional to the force on the mass. “Broadband” seismometers (velocity sensors, using electronics to extend the frequency to low values) are starting to be used in engineering seismology: the boundary between traditional strong-motion and weak-motion seismology is becoming blurred.
Digital strong-motion recording • Broadband: nominally flat response from dc to at least 40 Hz • But noise/ baseline problems can limit low-frequency information • High-frequency limit generally not a problem because these frequencies are generally filtered out of the motion by natural processes (exception: very hard rock sites) • High dynamic range (ADC 16 bits or higher) • Pre-event data usually available
Trifunac & Todorovska (2001)
Many networks of instruments, both traditional “strong-motion” and, more recently, very broad-band, high dynamic-range sensors and dataloggers
INSTRUMENTATION Kyoshin Net: Japanese strong motion network • 1000 digital instruments installed after the Kobe earthquake of 1995 • free field stations with an average spacing of 25 km • velocity profile of each station up to 20 m by downhole measurement • data are transmitted to the Control Center and released on Internet in 3-4 hours after the event http://www.k-net.bosai.go.jp
A number of web sites provide data from instrument networks • But no single web site containing data from all over the world. • An effort is still need to add broad-band data into the more traditional data sets.
WEB SITES COSMOS Consortium of Organizations for Strong - Motion Observation Systems http://www.cosmos-eq.org/
Measures of ground-motion intensity for engineering purposes • PGA, PGV • Response spectra (elastic, inelastic) • Others (avg. spectra over freq., power spectra, Fourier amplitude spectra) • Time series
Peak ground acceleration (pga) • easy to measure because the response of most instruments is proportional to ground acceleration • liked by many engineers because it can be related to the force on a short-period building • convenient single number to enable rough evaluation of importance of records • BUT it is not a measure of the force on most buildings • and it is controlled by the high frequency content in the ground motion (i.e., it is not associated with a narrow range of frequencies); records can show isolated short-duration, high-amplitude spikes with little engineering significance
Peak ground velocity (pgv) • Many think it is better correlated with damage than other measures • It is sensitive to longer periods than pga (making it potentially more predictable using deterministic models) • BUT it requires digital processing (no longer an important issue)
Peak ground displacement (pgd) • The best parameter for displacement-based design? • BUT highly sensitive to the low-cut (high-pass) filter that needs to be applied to most records (in which case the derived pgd might not represent the true pgd, unlike pga, for which the Earth imposes a natural limit to the frequency content). For this reason I recommend against the use of pgd.
Elastic response spectra (many structures can be idealized as SDOF oscillators)
At short periods, oscillator response proportional to base acceleration
At long periods, oscillator response proportional to base displacement
convert displacement spectrum into acceleration spectrum (multiply by (2π/T)2) Acceleration spectrum usually used in engineering
PGA generally a poor measure of ground-motion intensity. All of these time series have the same PGA:
But the response spectra (and consequences for structures) are quite different (lin-lin and log-log plots to emphasize different periods of motion):
DataProcessing • Data processing = removing long-period noise • Processing at high frequencies of much less concern
Baseline problems are common • Even for digitally recorded records • There can be many reasons for the shifts, and as a result it is not possible to design a single correction scheme to remove the long-period noise without affecting the long-period signal.
Many possible causes • Mechanical: • Hysteresis (mechanical/ electrical) • “Popcorn” noise • Other • Ground deformation • Tilt near earthquakes • Differential settlement • Other • Analog-Digital Conversion (ADC)
Seismologists may want residual displacements. Schemes have been tailored that claim to produce these. Although OK in some cases of large signal to noise, in general I am pessimistic about being to remove long-period noise and retain long-period signal.
A possible correction scheme • Modification of one proposed by Iwan et al. (1985) • Guarantees that velocity will have a value around 0.0 in the later part of the record (a physical constraint) • Choice of critical parameters is arbitrary unless they can be associated with a physical mechanism (as for the specific instrument studied by Iwan et al.)
Although the results look physically plausible, the residual displacements can be sensitive to t1, t2
But response spectra at periods of engineering interest can be insensitive to the baseline correction, which says that the “noise” is very long period • If abandon desire to recover residual displacements, then many methods are available for removing long-period noise, in addition to baseline correction: filtering, polynomial fits, combinations of above.
Although the results look physically plausible, the residual displacements can be sensitive to t1, t2Quadratic fit to velocity gives best fit to GPS residual displacementin this case
In spite of large differences in waveforms, the response spectra at periods of engineering interest are similar. Two general conclusions to be made here: • Filtering alone is often all that is needed • Response spectra at periods of engineering interest are often insensitive to filter cutoff periods for modern digital records
More examples, comparing displacements and SD from accelerograms and “high-rate” (1 sps) gps