Download
1 / 21
210 likes | 274 Views
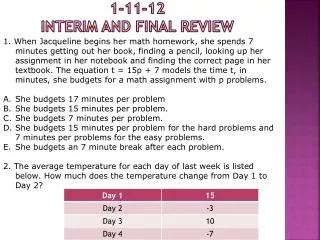
Final Review 1-13-12. 1. The original and sale price of an item are shown below. During which week did the price change the most? 2. Which graph has a negative slope? a. b. C. D. . Interim Review 1-13-12.

E N D
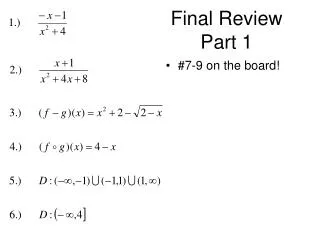
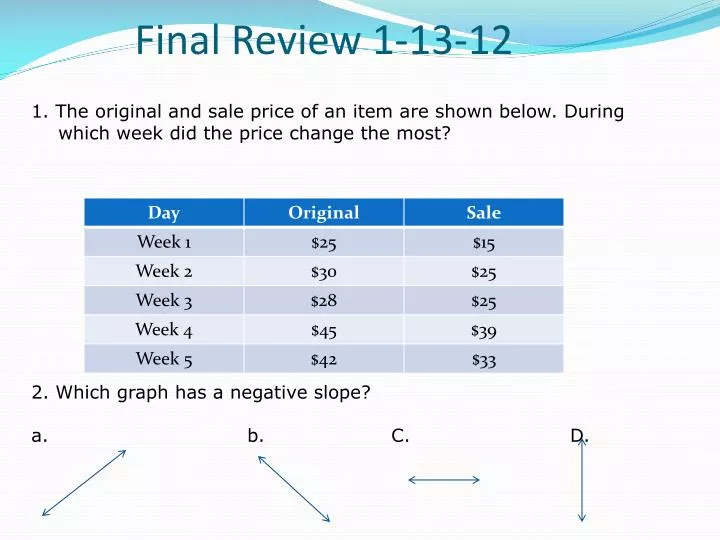
Final Review 1-13-12 1. The original and sale price of an item are shown below. During which week did the price change the most? 2. Which graph has a negative slope? a. b. C. D.
Interim Review 1-13-12 3. What is the slope of the line joining the points (6, -3) and (8,6)? 4. Simplify : 12x – 4y + 7x – 8y 5. p. 162 #68 6. p. 162 #66 7. p. 162 #67 8. p. 162 # 65
3.1 Graphing Linear Equations Objectives: By the end of the period, with an 85% accuracy, students will be able to: • Determine whether an equation is written in standard form • Graph linear equation using the x- and y-intercepts • Graph linear equations by making a table
Linear Equations • A linear equation is the equation of a line. It can be written in 3 different ways. • Standard-Form (Today’s focus) • Slope-Intercept Form • Point-Slope Form • Linear equations in Standard Form are written in the form Ax + By = Cand must satisfy 4 criteria: • A ≥0 • A and B are not both zero • A, B and C are integers whose greatest common factor is 1. • The exponents for each variable should equal 1.
IDENTIFYING LINEAR EQUATIONS Determine whether the equation is a linear equation. If so, write the equation in standard form and identify A, B and C. a. 4xy + 2y = 7 b. 2x = 3y + 3 c. y = 4 – 3x d. p. 159 #1 x = y - 5 e. p. 159 #13 5x + y2 = 25
Identify Linear Equations Example 1 B To write the equation with integer coefficients, multiply each term by 4. Original equation Multiply each side of the equation by 4. 3x – 4y = 32 Simplify. The equation is now in standard form, where A = 3, B = –4, and C = 32. Answer: This is a linear equation.
Graphing Using Intercepts • x-intercept - The x-coordinate where the graph crosses the x axis. • To find the x-intercept, let y = 0. • y-intercept - The y-coordinate where the graph crosses the y axis. • To find the y-intercept, let x = 0.
Graph by Using Intercepts Example Graph 4x – y= 4 using the x-intercept and the y-intercept. To find the x-intercept, let y = 0. 4x – y= 4 Original equation 4x – 0 = 4 Replace y with 0. 4x = 4 Simplify. x = 1 Divide each side by 4. To find the y-intercept, let x = 0. 4x – y = 4Original equation 4(0) – y = 4 Replace x with 0. –y = 4 Simplify. y = –4 Divide each side by –1.
Graphing Using Intercepts2x+ 5y = 10 x-intercept y-intercept Let y = 0 • 2x + 5y = 10 • 2x + 5(0) = 10 • 2x + 0 = 10 • 2x = 10 2 2 • x = 5 x-intercept • x –int. is the point (5,0) Let x = 0 • 2x + 5y = 10 • 2(0) + 5y = 10 • 0 + 5y = 10 • 5y= 10 5 5 • y = 2 y-intercept • y-int. is the point (0,2)
Graphing Using Intercepts7. y = 4 + x x-intercept y-intercept Let y = 0 • y = 4 + x • 0 = 4 + x • -4 -4 . • -4 = x x-intercept • x-int. is the point (-4,0) Let x = 0 • y = 4 + x • y = 4 + 0 • y = 4 y-intercept • y-int. is the point (0, 4)
Graphing Using Intercepts25. x = 5y + 5 x-intercept y-intercept Let y = 0 • x = 5y + 5 • x = 5(0) + 5 • x = 0 + 5 • x = 5 x-intercept • x –int. is the point (5,0) Let x = 0 • x = 5y + 5 • 0 = 5y + 5 • -5 - 5 • -5 = 5y • -5 -5 • -1= y y-intercept • y-int. is the point (0,-1)
Example: Find the x- and y-intercepts of the graphed segment. A. x-intercept is 10; y-intercept is 250 B. x-intercept is 10; y-intercept is 10 C. x-intercept is 250; y-intercept is 10 D. x-intercept is 5; y-intercept is 10
Example ANALYZE TABLES Jules has a gas card for a local gas station. The table shows the function relating the amount of money on the card and the number of times he has stopped to purchase gas.A. Determine the x- and y-intercepts of the graph of the function. • x-intercept is 5; y-intercept is 125 • x-intercept is 5; y-intercept is 5 • x-intercept is 125; y-intercept is 5 • x-intercept is 5; y-intercept is 10
Example B. Describe what the y-intercept of 125 means in the previous problem. • It represents the time when there is no money left on the card. • It represents the number of gas stops. • At time 0, or before any gas stops, there was $125 on the card. • This cannot be determined.
Individual Practice • Do p. 159 - 160 5, 6, 19, 21 and 12
Graphing By Making A Table Graph x + 2y = 4 first get y by itself x + 2y = 4 -x -x 2y = -x + 4 2 2 2 y = -1x + 2 2
p. 159 Graph each equation. x = 3 Vertical line through the x axis at 3. Example like 9. y= 5 Horizontal line through the y axis at 5.
Graphing By Making A Table Example: Graph using a table Y = 2x + 3
Homework 1-13 • Read 3-1 Take Notes • P. 159 14-28 even, • Read 3-1 Take Notes