Download
1 / 29
290 likes | 413 Views
Police reform evidence for change. JAS Stats User Day Police and Fire Reform. Why a single service?. Implications for data and analysis Neil Grant Kirsty Bosley 5/3/12. What we’ll talk about. Why reform What stage are the reforms at What are JAS doing – past/present

E N D
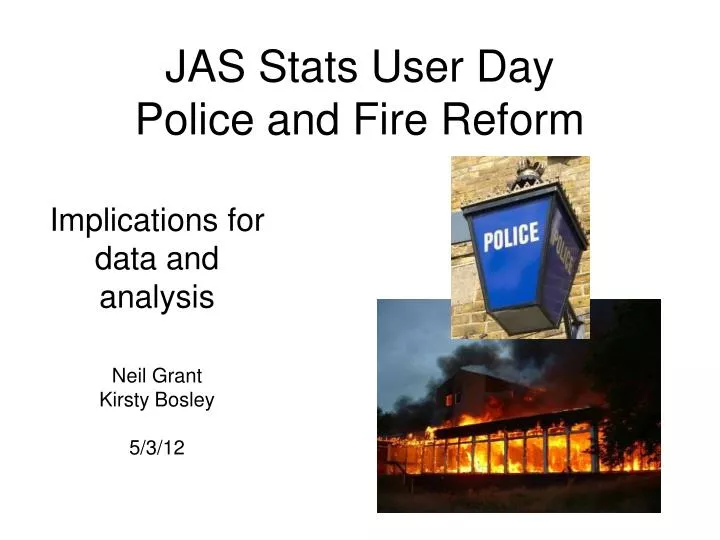
Police reform evidence for change JAS Stats User Day Police and Fire Reform Why a single service? Implications for data and analysis Neil Grant Kirsty Bosley 5/3/12
What we’ll talk about • Why reform • What stage are the reforms at • What are JAS doing – past/present • The future for data and analysis?
Performing well Est. Scottish DEL 2009-10 to 2026-27
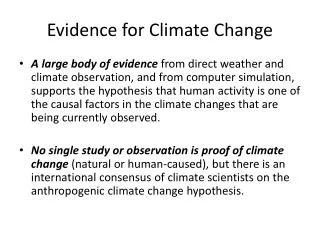
Why reform? • Protect and improve local services, the jewel in the crown, despite financial cuts; by stopping duplication of support services eight times over and not cutting the front line • Create more equal access to specialist support and national capacity – like murder investigation teams, firearms teams and fire investigations - where and when they are needed • Strengthen the connection between services and communities; by creating a new formal relationship with all 32 local authorities; involving many more locally elected members and better integrating with community planning partnerships.
Structure • 8 Forces • 1 Parliament
Structure • 8 Forces • 1 Parliament • 32 LAs
2011 January February March April May June July August Sept Oct Nov Dec CSR 12/13 Bud Cabinet Agree Policy Consultation Preparation of Legislation to Bill Introduction 2012 January February March April May June July August Sept Oct Nov Dec 1st Cont NFY LGE Olympics Parliamentary Stages of Bill Stg 1 Stg 2 Stg 3 Implementation of Legislation Appointment of Conveners Appointment of Chief Officers Appointment of Board Members Staff and Property Trans 2013 January February March April May June July August Sept Oct Nov Dec NFY Imp of Leg (cont) Apt of CO’s Staff and Property Transfer Prep for New CO
Fire Statistics, Scotland - Incidents Publications : http://www.scotland.gov.uk/Topics/Statistics/Browse/Crime-Justice/PubFires Additional Datasets: Local Authority datasets 2009/10, 2010/11 FRS 12 Year Trend Scotland Level since 1990 http://www.scotland.gov.uk/Topics/Statistics/Browse/Crime-Justice/Datasets/DatasetsFire Fire and Rescue Service Statistics – Scotland Work force, fire safety activities Publications : http://www.scotland.gov.uk/Topics/Statistics/Browse/Crime-Justice/PubFireRescue Current SG fire statistics
What have JAS been doing? Statistics publications Reform analysis • Research • OBC • Legislation, Financial Memo • Consultations
We told people what the current picture looks like Fires and fire fatalities are falling… 1999 to 2010 (provisional) Where the fires occurred Numbers of fire fatalities Chimney fires Secondary fires Other primary fires Road Vehicles Other buildings Dwellings 3
We told people how Scottish FRSs compare with other parts of the UK Expenditure per 1,000 population excluding firefighter pensions CIPFA 2009-10 5
We told people where the money was spentTotal spend in Scotland 2009/10 4
…and lots more Spend per 1000 population by fire and rescue service Total spend by fire and rescue service Varied job structure across the UK FRSs Varied job structure across Scottish FRSs
Recorded Crime in Scotland Homicide in Scotland Domestic Abuse Recorded by the Police in Scotland Racist Incidents Recorded by the Police in Scotland Recorded Crimes and Offences Involving Firearms Firearm Certificate Statistics Drug Seizures by Scottish Police Forces Scottish Index of Multiple Deprivation 2009 Scottish Neighbourhood Statistics Police Officer Quarterly Strength Statistics Scottish Policing Performance Framework Main Justice Statistics Publication Webpage http://www.scotland.gov.uk/Topics/Statistics/Browse/Crime-Justice/Publications Current SG police statistics
We told people what the current picture looks like - homicide
We’ve looked at service variation 1 • Performance variation • Public satisfaction 75% to 89% • Spend per resident £147-200 • Absence rates 3.0% to 4.3% • Standardised best practice – potential savings • Overtime £6.5m p.a. • HR £9m p.a. • Press & media £1.2 p.a. • Sickness absence – 120 FTE officers
Recorded crimes per 10,000 population, 2010-11 We’ve looked at service variation 2 • Range from: • 36 in Orkney • 47 in Eilean Siar, to • 140 in Aberdeen City • 156 in Glasgow City
Percentage of recorded crimes cleared up 2010-11 We’ve looked at service variation 3 • Range from: • 70 in Eilean Siar • 69 in D&G, to • 36 in East Dunbartonshire and East Renfrewshire
More sustainable We’ve looked at service variation 4 • Outline Business Case / Fin Memo • TOM • £131m long term efficiencies Police OBC efficiencies
What about the future? • The Justice Analytical Services Division Analytical Programme 2011-12: http://www.scotland.gov.uk/Topics/Statistics/Browse/Crime-Justice/JASAP11-12 • More user consultation • JAS statistical review • The introduction of a single police force and FRS will also affect the products we produce
Single service New Geography for publications – Scotland and Local Authority Work with the Reform workstreams – Performance Management project – many interdependancies Developing work – FSEC, SIMD and SNS Fire statistics in the future
FRS Performance Indicators National Outcomes FRS Outcomes Primary indicators FRS Outcomes FRS Outcomes FRS Outcomes Inputs Inputs Inputs Inputs Secondary indicators
Performance indicators against Intermediate Benefits Improved service outcomes Protecting frontline services Simplification of the delivery landscape Ability to respond quickly to future challenges Improved National resilience and interoperability Close engagement with local communities and other stakeholders End benefits Reduced harm to, and greater resilience of, public, property, economy and environment from fires and other emergencies through improved outcomes. Greater ability to respond to, and mitigate social, economic and environmental effects from, national emergencies Improved use of public money, generating greater public satisfaction, by reducing costs through efficiently and effectively applying risk based management of resources and promote increased flexibility. Greater investment in the right skills and attitudes to deliver high quality, value for money services in a positive environment for everyone. Improved Prevention Improved Protection Emergency Response Public Value People Fire cas Fire cas Delib other primary fires Interim benefits All fires All fires All fires Secondary fires Fire cas Dw fires Delib/acc Dw fires All fires Special services All fires Dw fires Fire cas Delib other primary fires Fire cas OB fires RTC cas OB fires Fire cas Fire cas Vehicle fires OB fires RTC cas Fire cas Fire cas Spec Serv incs attended Vehicle fires (accidental) Rate and size of OB fires RTC cas Rate and size of OB fires Rate and size of OB fires RTC cas Reduced number of fires and other emergency incidents. Reduced number of deaths and injuries from fires and other emergencies. Greater influence and regulation of the built environment to protect people, property and the environment from harm. Better education of, and engagement with, public Higher quality response to emergencies. Improved state of preparedness for emergencies, with more effective emergency cover arrangements. Improved resilience during peak activity levels and business disruption. More economic growth. Better designed, high value for money services. Improved quality of life outcomes for communities. Higher performing, better trained enabled and committed workforce working in a positive environment. Competent and capable leaders and managers. Lower levels of ill discipline, absenteeism and staff turnover. Attacks on ff Fire safety audit Fire safety audit Fire safety audit Attacks on ff CFS activity CFS activity Attacks on ff Fire safety audit RIDDOR inj rate FA malicious RIDDOR inj rate RIDDOR inj rate Work force monitoring – E&D CFS activity False alarm - equip Costs CFS activity CFS activity Work force monitoring – E&D Work force monitoring – E&D Work force monitoring – E&D
Local Pathfinders • Local engagement and scrutiny testing • Local Commander and council • Diverse LA mix • Apr 2012 – Mar 2013 • Ongoing formative/action research Pathfinders – LA, police, FRS Pathfinders – LA, police Networkers
Police statistics in the ‘future’ • Single service • New geographies - LA not PFA • Future analytical functions of the services? • Government role? • Adding ‘value’ • Professional Expertise – Stats Code • Contextual and policy interpretation • Independence
Police Performance Indicators • Review of SPPF • HMICS lead, JAS support • Draft PIs within 4 HMICS scrutiny areas • Outcomes • Specialist Policing • Local Policing • Corporate and Support Services • Pre-reform baseline • Local level indicators
Reform Programme Evaluation • Why evaluate? • Requirements – process and impact • Benefits Realisation / Programme Evaluation • Partnership working • Timing