Download
1 / 11
140 likes | 427 Views
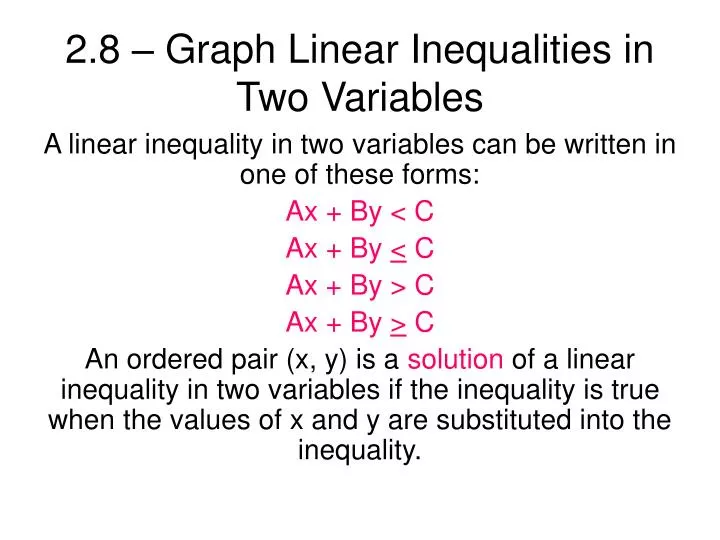
2.8 – Graph Linear Inequalities in Two Variables. A linear inequality in two variables can be written in one of these forms: Ax + By < C Ax + By < C Ax + By > C Ax + By > C

E N D
2.8 – Graph Linear Inequalities in Two Variables A linear inequality in two variables can be written in one of these forms: Ax + By < C Ax + By < C Ax + By > C Ax + By > C An ordered pair (x, y) is a solution of a linear inequality in two variables if the inequality is true when the values of x and y are substituted into the inequality.
2.8 – Graph Linear Inequalities in Two Variables Example 1: Which ordered pair is a solution of 3x + 4y > 8? (6, -3) (0, 2) (-2, -1) (-3, 5)
2.8 – Graph Linear Inequalities in Two Variables Example 2: Which ordered pair is a solution of 5x – 2y < 6? (0, -3) (5, 5) (1, -2) (3, 3)
2.8 – Graph Linear Inequalities in Two Variables Example 3: Tell whether the given ordered pair is a solution of 5x – 2y < 6. (0, -4) (2, 2) (-3, 8) (-1, -7)
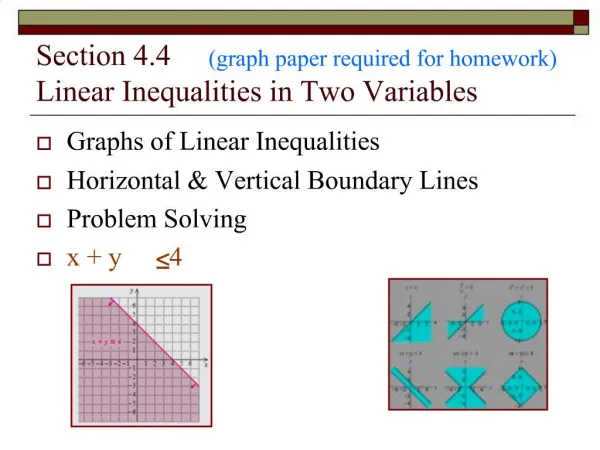
2.8 – Graph Linear Inequalities in Two Variables The graph of a linear inequality in two variables is the set of all points in a coordinate plane that represent the solutions of the inequality.
2.8 – Graph Linear Inequalities in Two Variables Example 4: Graph the following graphs in a coordinate plane. y < -3 x < 2
2.8 – Graph Linear Inequalities in Two Variables Example 5: Graph the following graphs in a coordinate plane. y > 2x 5x – 2y < -4
2.8 – Graph Linear Inequalities in Two Variables Example 6: Graph the following graphs in a coordinate plane. y > 2x + 3 x + 3y < 9
2.8 – Graph Linear Inequalities in Two Variables Example 7: You have two part-time summer jobs, one that pays $9 per hour and another that pays $12 per hour. You would like to earn at least $240 a week. Write an inequality describing the possible amounts of time you can schedule at both jobs. Graph the inequality. Identify three possible solutions of the inequality.
2.8 – Graph Linear Inequalities in Two Variables Example 8: Graph y > -2|x – 3| + 4