Download
1 / 21
230 likes | 494 Views
Lesson 2.10 Solving Linear Inequalities in Two Variables Concept : Represent and Solve Systems of Inequalities Graphically EQ : How do I represent the solutions of an inequality in two variables? (Standard REI.12)

E N D
Lesson 2.10 Solving Linear Inequalities in Two Variables Concept: Represent and Solve Systems of Inequalities Graphically EQ: How do I represent the solutions of an inequality in two variables? (Standard REI.12) Vocabulary: Solutions region, Boundary lines (dashed or solid), Inclusive, Non-inclusive, Half plane, Test Point 2.3.1: Solving Linear Inequalities in Two Variables
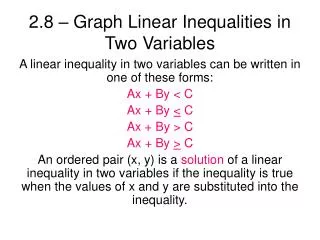
Introduction Solving a linear inequality in two variables is similar to graphing a linear equation, with a few extra steps that will be explained on the following slides. *Remember that inequalities have infinitely many solutions and all the solutions get represented through the use of shading. http://youtu.be/Eiwi3FvQumU 2.3.1: Solving Linear Inequalities in Two Variables
Key Concepts A linear inequality in two variables has a half plane as the set of solutions. A half plane is a region containing all points that has one boundary, which is a straight line that continues in both directions infinitely. 2.3.1: Solving Linear Inequalities in Two Variables
Inequality Brothers > ≤ < ≥ Non-Inclusive aka: Open Inclusive aka: Closed 2.3.1: Solving Linear Inequalities in Two Variables
Guided Practice- Example 1 Graph the solutions to the following inequality. 2.3.1: Solving Linear Inequalities in Two Variables
Guided Practice: Example 1, continued Graph the inequality as a linear equation. Since the inequality is non-inclusive, use a dashed line. y = x + 3 To graph the line, plot the y-intercept first, (0, 3). Then use the slope to find a second point. The slope is 1. Count up one unit and to the right one unit and plot a second point. Connect the two points and extend the line to the edges of the coordinate plane. 2.3.1: Solving Linear Inequalities in Two Variables
Guided Practice: Example 1, continued 2. Shade the appropriate area. Since the symbol > is used we will shade above the y-intercept. 2.3.1: Solving Linear Inequalities in Two Variables
Guided Practice: Example 1, continued 3. Pick a test point above or below the line and substitute the point into the inequality. Choose (0, 0) because this point is easy to substitute into the inequality. y > x + 3 (0) > (0) + 3 0 > 3 This is false! Since the test point makes the inequality false, all points on that side of the line make the inequality false. Therefore we were correct to shade above the line. 2.3.1: Solving Linear Inequalities in Two Variables
Guided Practice- Example 2 Graph the solutions to the following inequality. 2.3.1: Solving Linear Inequalities in Two Variables
Guided Practice: Example 2, continued 1. Graph the inequality as a linear equation. Since the inequality is inclusive, use a solid line. To graph the line, plot the y-intercept first, (0, 2). Then use the slope to find a second point. The slope is 3. Count up three units and to the right one unit and plot a second point. Connect the two points and extend the line to the edges of the coordinate plane. 2.3.1: Solving Linear Inequalities in Two Variables
13 2.3.1: Solving Linear Inequalities in Two Variables 2.3.1: Solving Linear Inequalities in Two Variables
Guided Practice: Example 2, continued 2. Shade the appropriate area. Since the symbol is used we will shade above the y-intercept. 2.3.1: Solving Linear Inequalities in Two Variables
Guided Practice: Example 2, continued 3. Pick a test point above or below the line and substitute the point into the inequality. Choose (0, 0) because this point is easy to substitute into the inequality. (0) > 3(0) + 2 0 > 0 + 2 0 > 2 This is false! Since the test point makes the inequality false, all points on that side of the line make the inequality false. Therefore we were correct to shade above the line 2.3.1: Solving Linear Inequalities in Two Variables
Guided Practice- Example 3 Graph the solutions to the following inequality. 2.3.1: Solving Linear Inequalities in Two Variables
Guided Practice: Example 3, continued 1. Graph the inequality as a linear equation. Since the inequality is not inclusive, use a dashed line. To graph the line, plot the y-intercept first, (0, -1). Then use the slope to find a second point. The slope is. Count down two units and to the right three units and plot a second point. Connect the two points and extend the line to the edges of the coordinate plane. 2.3.1: Solving Linear Inequalities in Two Variables
18 2.3.1: Solving Linear Inequalities in Two Variables 2.3.1: Solving Linear Inequalities in Two Variables
Guided Practice: Example 3, continued 2. Shade the appropriate area. Since the symbol is used we will shade below the y-intercept. 19 19 2.3.1: Solving Linear Inequalities in Two Variables
Guided Practice: Example 3, continued 3. Pick a test point above or below the line and substitute the point into the inequality. Choose (0, 0) because this point is easy to substitute into the inequality. (0) (0) - 1 0 0 - 1 0 -1 This is false! Since the test point makes the inequality false, all points on that side of the line make the inequality false. Therefore we were correct to shade below the line 2.3.1: Solving Linear Inequalities in Two Variables
You Try! Graph the following inequalities: 1. 2.