Download
1 / 30
310 likes | 513 Views
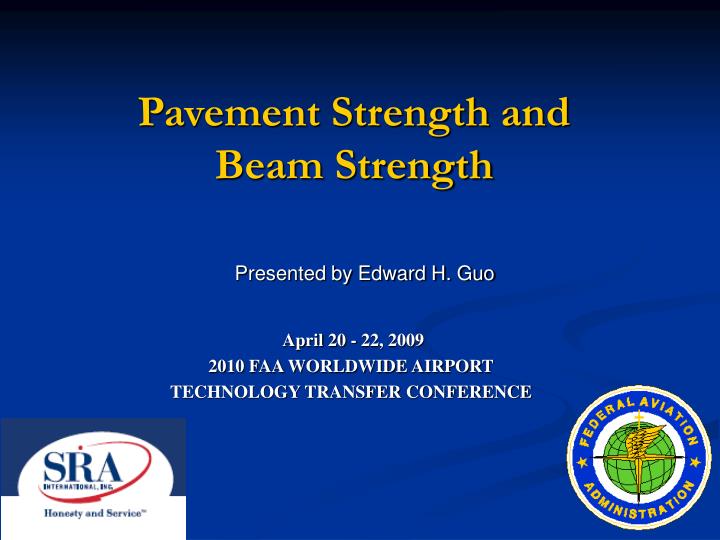
Pavement Strength and Beam Strength. Presented by Edward H. Guo. April 20 - 22, 2009 2010 FAA WORLDWIDE AIRPORT TECHNOLOGY TRANSFER CONFERENCE. Outline. (1) What we have learned from the history? (2) Concept of the three-stage failure mechanism;

E N D
Pavement Strength and Beam Strength Presented by Edward H. Guo April 20 - 22, 2009 2010 FAA WORLDWIDE AIRPORT TECHNOLOGY TRANSFER CONFERENCE
Outline • (1) What we have learned from the history? • (2) Concept of the three-stage failure mechanism; • (3) Measurement and analysis of pavement strength – failure stage I; • (4) Measurements of pavement fatigue strengths – failure stage II and III • (4) Summary of Findings
Correct FAA Model in AC150/5320-6D Nine Failure Models for Airport Concrete Pavement Design Having Been Reviewed /MR, independent failure indicator in all design models Mis-printed FAA Model
Findings by the Reviewers • “Although a variety of fatigue models are available for use in concrete airfield pavement design, each provides different results, largely because of the differences in the way that they were developed.” • “A runway designed to support 1,200 annual departures of a Boeing 727 aircraft can vary in pavement thickness from 375 to 457 mm (14.75 to 18 inches), depending on the choice of pavement design method.” • “However, it is false to assume that one design method is better than another because the divergence”.
Failure Model in AC 150/5320-6D 1978 The ratio (/ MR, design factor) is used as an independent parameter for design Assumption was based on the observation in full scale tests: When (slab) equals to MR (beam), the pavement fails after 5000 coverage. Safety factor is 1.3. Different equations were used for COV < 5000 or COV > 5000,
Our Comments • The requirements for “Fatigue Analysis” can not be satisfied unless MR (Beam) is close to MR (Slab). The stress and the strength should be obtained from the same specimen (or structure) under the same type of load. See Miner, M.A., 1945, “Cumulative Damage In Fatigue”, Transactions, American Society of Mechanical Engineer, Vol. 67, pp159-164. It is not satisfied by most models. • The number of data for N < 100 was very limited so the reliability of using the models for N < 100 is questionable. However, none of above model can be reliable for overloaded pavement evaluation for avoiding pavement strength failure. • The failure mechanism might be the key to answer why the significant differences exit.
New pavement without distress A full depth and full length crack has been developed A crack is initiated End of pavement life. Major rehabilitation or reconstruction is needed Completed failed Logic Line SCI Stage 2 Stage 1 100 Stage 3 A B C To a Model for Design & Analysis D Ray Rollings Model currently used in FAA Design Procedure LOG(N) E SCI: Structural Condition of Pavement; N: Number of Load Coverage Where the “Three Stages Failure Mechanism” Come From?
Measured Pavement Strength – Case I: under A Moving Gear At longitudinal joint, crack was between two gages, type I At longitudinal joint At Transverse joint, crack was going through the gage, type II
Measured Pavement Strength – Case II: Critical Load Location
Measured Pavement Strength – Case III: by Static Load (Top-down)
Pavement Strength Measured through Top-Down Crack (Between gages 3 and 5, and 5 inch from gage 5) Strength 80 10-6 27240 Kg 60000 lbs 11350 Kg 25000 lbs
Measured Pavement Strength – Case IV: by Static Load (Bottom-up) Strength 100 10-6 30k 40k 25k 35k 45k 55k 50k
CONCLUSIONPavement Flexural Strength and the Beam Flexural Strength (ASTM C78) are in the Same Scale
Three-stage Failure Mechanism Observed in Fatigue Study at University of Illinois1998 - 2005 • Roesler, Jeff, 1998, “Fatigue of Concrete Beams and Slabs”, PhD. Thesis, Civil Engineering in the Graduate College of the University of Illinois at Urbana-Champaign. • Roesler, Jeff, P. C. Littleton, J.E. Hiller and G.E. Long, 2004 “Effects of Stress State on Concrete Slab Fatigue Resistance”, Technical Draft Final Report under Grant DOT 95-C-001. • Roesler, J.R., Hiller, J.E., and Littleton, P.C. Large-Scale Airfield Concrete Slab Fatigue Test, 9th International Conference on Concrete Pavement, August 13-18, 2005, Colorado Springs, CO, 23 pp.
In failure stage three The first crack initiated at load 25000 lbs The second crack was initiated The second crack was completed. The two-piece slab became four pieces Deflection = 0.03 inch at the end of linear elastic zone – stage one Failure stage two Deflection = 0.09 inch.The first crack was completed, The one-piece slab became Two pieces Failure stage one Three-Stage Failure Observed in Test Slab 1D
Major Difference Between Two Findings • Full scale tests under FAA: Pavement strength and flexural strength are relatively similar – they are in the same scale. The finding supports the assumption in 150/5320-6D. • Study under U of Illinois: “The concrete slabs’ flexural strengths were on average 2.8 times the strength of simply-supported beams”. More detailed Findings in Full Scale Tests • The measured top-down pavement strengths were slightly lower than the beam flexural strength; • The measured bottom-up pavement strengths were slightly higher than the beam flexural strength; • They were in the same scale What Caused the Difference ?
How the MR (Slab) 2.8 MR (Beam) Was Obtained? (3) In failure stage three (1) Illinois study: Illislab was used to match the measured deflection at the end of failure stage two by changing k. The corresponding edge stress was defined as “pavement strength” The second crack completed Failure stage two Failure stage one The second crack initiated The first crack initiated and load 25000 lbs (2) If the data at the end of stage one is used, the findings will be similar to that by the FAA full scale tests.
Summary • Both FAA and Illinois tests were reliable; • Both data contain important information on slab failure mechanism; • The failure should be analyzed stage by stage rather than by a combined stage for obtaining correct conclusion.
(4) Failure Stage Two: Measurements of pavement fatigue strengths – Failure mechanism of top-down and bottom-up cracks are different.
Measured Fatigue Failure, Stage Two Data received in 2000 Data received in 2002
Failure Stage Three DOT/FAA/ AR-09/57
Importance of Three-Stage Failure Mechanism • (1) From the test data received from both FAA and University Illinois, three-stage failures have been repeatedly observed; • (2) If the failure mechanism in the first two stages was analyzed by one-stage approach, misunderstanding occurred;
Welcome all of your Comments and please to visit:http://www.airporttech.tc.faa.gov/naptf/ Thank You !!