Download
1 / 20
200 likes | 409 Views
Modeling Growth and Decay. Section 1.2. Example A.

E N D
Modeling Growth and Decay Section 1.2
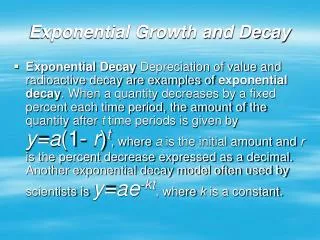
Example A • An automobile depreciates, or loses value, as it gets older. Suppose that a particular automobile loses one-fifth of its value each year. Write a recursive formula to find the value of this car when it is 6 years old, if it cost $23,999 when it was new. The value of the car has depreciated by one-fifth of its value. Why can we say that its current value is one minus one-fifth or four-fifths of its value?
Example A • An automobile depreciates, or loses value, as it gets older. Suppose that a particular automobile loses one-fifth of its value each year. Write a recursive formula to find the value of this car when it is 6 years old, if it cost $23,999 when it was new. We can write this sequence as:
Looking for the Rebound • When you drop a ball, the rebound height becomes smaller after each bounce. In this investigation you will write a recursive formula for the height of a real ball as it bounces. 1. Hold the motion sensor above the ball. 2. Press the trigger, then release the ball. 3. If the ball drifts, try to follow it and maintain the same height with the motion sensor. 4. If you do not capture at least 6 good consecutive bounces, repeat the procedure.
Step 1: Set up your calculator and motion sensor collect bouncing-ball data. • Step 2: The data transferred to your calculator are in the form (x, y), where x is the time since you pressed the trigger, and y is the height of the ball. Trace the data graphed by your calculator to find the starting height and the rebound height after each bounce. Record your data in a table. Enter the data in your graphing calculator.
Step 3: Graph a scatter plot of points in the form (bounce number, rebound height). Record the graphing window you use.
Step 4: Compute the rebound ratio for consecutive bounces using your graphing calculator and the spreadsheet. Define cell c1=b2/b1. Copy and fill this formula down column C.
Decide on a single value that best represents the rebound ratio for your ball. Use this ratio to write a recursive formula that models your sequence of rebound height data, and use it to generate the first six terms. If the rebound ratio is 0.70 and the initial height is 1.081, then
Compare your experimental data to the terms generated by your recursive formula. • How close are they?
Describe some of the factors that might affect this experiment. For example, how might the formula change if you used a different kind of ball?
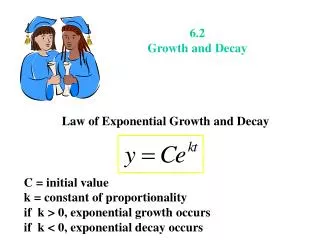
You may find it easier to think of the common ratio as the whole, 1, plus or minus a percent change. In place of r you can write (1 + p) or (1- p). • When the car was depreciated it lost 20% of its value or it was now worth (1-0.20) of its original value. • When the ball bounced to a new height that was 64% of it original height, the ball lost 1-0.64 of its original height.
Example B • Gloria deposits $2,000 into a bank account that pays 7% annual interest compounded annually. This means the bank pays her 7% of her account balance as interest at the end of each year, and she leaves the original amount and the interest in the account. When will the original deposit double in value? • The balance starts at $2,000 and increases by 7% each year.
Use your calculator to compute year-end balances recursively. • It will take about 11 years for the money to double.
Use your calculator to set up a spreadsheet to compute year-end balances recursively. • It will take about 11 years for the money to double.
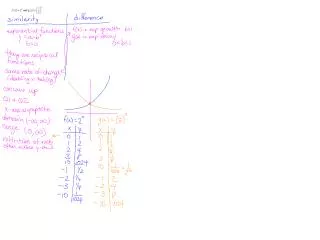
What kind of sequences did you see in Examples A and B? • Geometric Sequences • How do these sequences compare with one another? • Car Depreciation – decreasing geometric sequence (decay) • Bouncing Ball – decreasing geometric sequence (decay) • Bank Account – increasing geometric sequence (growth)
Additional Examples 1. You buy a pair of limited edition shoes, then immediately sell them on an online auction site. The bidding starts at $100 and each bid pushes the price up by 15%. Make a table. If the 10th bidder purchases the shoes, how much does that person pay?
2. Rewrite the expression so that the variable, , appears only once.
3. Write a recursive formula for the height of a ball that is dropped from 150 cm and has a 60% rebound ratio.