Download
1 / 11
110 likes | 345 Views
By Ben Colbourne. Iceberg Decay modeling. Why Is iceberg decay prediction important ? . The rate of iceberg deterioration is important to those modeling iceberg drift and associated threats posed to commercial fishing, transport, and resource development industries in iceberg-prone waters .

E N D
By Ben Colbourne Iceberg Decay modeling
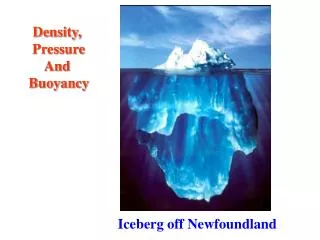
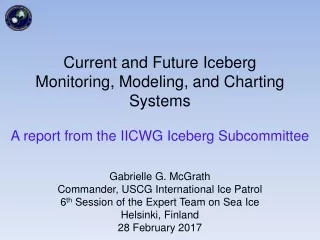
Why Is iceberg decay prediction important ? • The rate of iceberg deterioration is important to those modeling iceberg drift and associated threats posed to commercial fishing, transport, and resource development industries in iceberg-prone waters. • Iceberg deterioration rates are difficult to predict due to the natural complexity of the ocean environment and iceberg characteristics. • The scarcity of full scale data and the cost of obtaining it prevent solving the dilemma at the full scale, thus analytical, theoretical and numerical solutions are sought International Ice Patrol map showing know iceberg positions, Data collected through observation flights
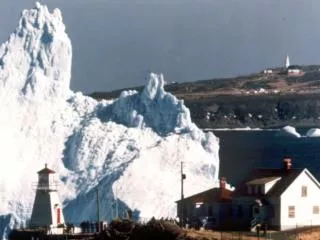
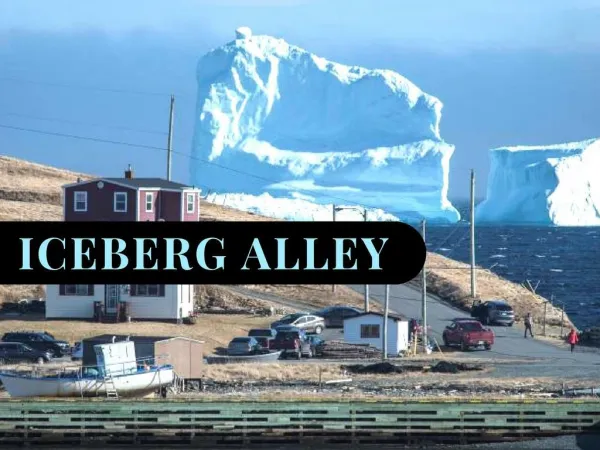
Iceberg Collapse in Battle Harbour NL Iceberg Decay Factors Thermodynamic Process Solar radiation Forced Convection Buoyant convection Wave erosion Mechanical Process Cracking and Calving A good question is: “How many of these factors can be accurately modeled using computer flow analysis”
Goal Of Work Term To create standard simple series of ice melt experiments and data sets that can be used to aid in the verification and calibration of Computational Fluid Dynamics and Thermodynamics models to simulate iceberg melting. Rough representation of flow around an iceberg
Types of Experiments Executed Preliminary Set up experiments • The making of consistent ice easily • The proper characteristics of dye • A method for dye injection and image capture Ice Experiments • Ice Sheet experiments • Dyed ice block experiments • Mass Flux Experiments
Key findings of preliminary testing Tank set up Dye / Visualization • Fast dissolve water softener salt works well for adjustment of Water density • High temperature lights need to avoided • In free floating ice test’s the ice top surface area has to be less the 4 % of the tank free surface • Accurate salinity and temperature probe needed for all tests • Dye Has to be same density and temperature as the flow you are trying to track • Dye has to be low viscosity and have no visible particles • Dye frozen in to pockets in the ice can work effectively • Sharp white background on all sides of the tank not in use increases visibility
Ice Wall Testing A 10 cm thick wall of ice was placed vertically on one side of the tank and flow was documented • there was a noticeable notch at the top of the submerged portion of the ice • There was a great deal of small bubble release • There was grater ice decay in the top portion of the ice • There was separation of a downward flow of water on the ice face and the rest of the water in the tank
Free Floating Dyed Ice Block A 10 cm cube of ice was frozen with dye impregnated the melt flow was then recorded • 60 % of melt floated constantly to the surface • 40% Fell in a loose haze to the bottom • Surface water was low salinity • Water near the bottom of the tank had a reduction in salinity • Strong rotation and vortex created Shape Before Melt Shape After Melt
Mass Flux Cube testing Four equal 5 cm cubes of ice were submerged in saline water and the mass was recorded every 4 min • Results were uniform and a reasonable, therefore a mass flux rate could be predicated for the given shape • Due to the necessity of weighing melt rate will be affected due to in water disruption
Flow 3D does have the ability to compute melting • Problems with • Software assuming flow is steady state due to slow flow • Large number of variables ( temperature, density, mass flow, two fluids with a mixing property) • Long duration of simulations with a very fine matrix required makes simulation very cumbersome • What was learned • The level of complexity that Flow 3D can calculate • How Flow 3D handles the changing shape of the object • Types of lab tests needed to validate and aid in the creation of simulations This work would be suited to a person with advanced computer modeling experience.
What Next ? • Choose which of the previous tests will be most useful in the calibration of computer models of ice in saline water • Execute these tests with greater accuracy and consistency • Record a data set and flow patterns in a way that can be used to validate flow analysis software • Record a method for recreating these experiment with modifications to suit many applications