Download
1 / 1
10 likes | 262 Views
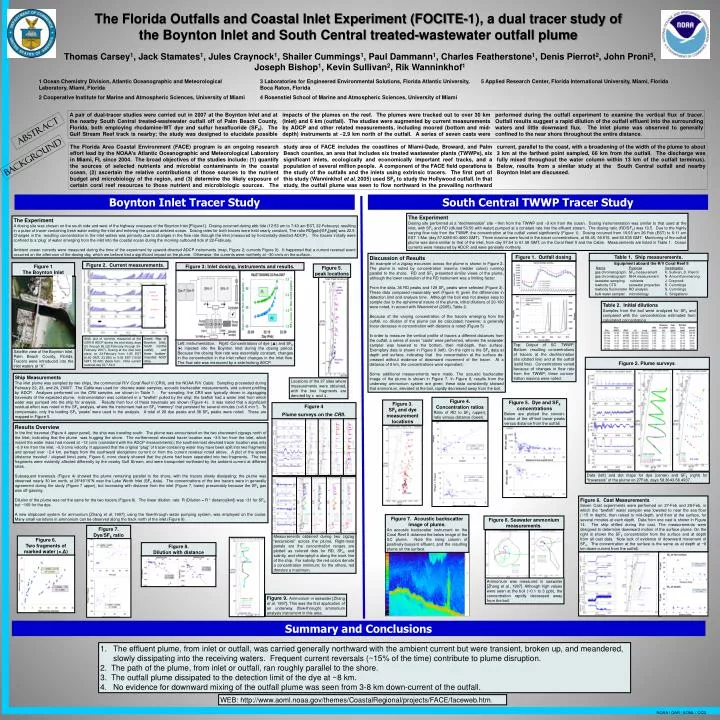
The Florida Outfalls and Coastal Inlet Experiment (FOCITE-1), a dual tracer study of the Boynton Inlet and South Central treated-wastewater outfall plume.

E N D
The Florida Outfalls and Coastal Inlet Experiment (FOCITE-1), a dual tracer study of the Boynton Inlet and South Central treated-wastewater outfall plume Thomas Carsey1, Jack Stamates1, Jules Craynock1, Shailer Cummings1, Paul Dammann1, Charles Featherstone1, Denis Pierrot2, John Proni5, Joseph Bishop1, Kevin Sullivan2, Rik Wanninkhof1 1 Ocean Chemistry Division, Atlantic Oceanographic and Meteorological Laboratory, Miami, Florida 2 Cooperative Institute for Marine and Atmospheric Sciences, University of Miami 3 Laboratories for Engineered Environmental Solutions, Florida Atlantic University, Boca Raton, Florida 4 Rosenstiel School of Marine and Atmospheric Sciences, University of Miami 5 Applied Research Center, Florida International University, Miami, Florida A pair of dual-tracer studies were carried out in 2007 at the Boynton Inlet and at the nearby South Central treated-wastewater outfall off of Palm Beach County, Florida, both employing rhodamine-WT dye and sulfur hexafluoride (SF6). The Gulf Stream Reef track is nearby; the study was designed to elucidate possible impacts of the plumes on the reef. The plumes were tracked out to over 30 km (Inlet) and 6 km (outfall). The studies were augmented by current measurements by ADCP and other related measurements, including moored (bottom and mid-depth) instruments at ~2.9 km north of the outfall. A series of seven casts were performed during the outfall experiment to examine the vertical flux of tracer. Outfall results suggest a rapid dilution of the outfall effluent into the surrounding waters and little downward flux. The inlet plume was observed to generally confined to the near shore throughout the entire distance. Abstract The Florida Area Coastal Environment (FACE) program is an ongoing research effort lead by the NOAA’s Atlantic Oceanographic and Meteorological Laboratory in Miami, FL since 2004. The broad objectives of the studies include: (1) quantify the sources of selected nutrients and microbial contaminants in the coastal ocean, (2) ascertain the relative contributions of those sources to the nutrient budget and microbiology of the region, and (3) determine the likely exposure of certain coral reef resources to those nutrient and microbiologic sources. The study area of FACE includes the coastlines of Miami-Dade, Broward, and Palm Beach counties, an area that includes six treated wastewater plants (TWWPs), six significant inlets, ecologically and economically important reef tracks, and a population of several million people. A component of the FACE field operations is the study of the outfalls and the inlets using extrinsic tracers. The first part of this study (Wanninkhof et al, 2005) used SF6 to study the Hollywood outfall. In that study, the outfall plume was seen to flow northward in the prevailing northward current, parallel to the coast, with a broadening of the width of the plume to about 3 km at the farthest point sampled, 66 km from the outfall. The discharge was fully mixed throughout the water column within 13 km of the outfall terminus). Below, results from a similar study at the South Central outfall and nearby Boynton Inlet are discussed. Background Boynton Inlet Tracer Study South Central TWWP Tracer Study The Experiment Dosing site performed at a “dechlorination” site ~1km from the TWWP and ~3 km from the ocean. Dosing instrumentation was similar to that used at the inlet, with SF6 and RD (diluted 50:50 with water) pumped at a constant rate into the effluent stream. The dosing ratio (RD/SF6) was 10.5. Due to the highly varying flow rate from the TWWP, the concentration at the outfall varied significantly (Figure 1). Dosing occurred from 10:05 am 26-Feb (EST) to 6:11 am EST 1-Mar (day 57.6285-60.4660 GMT). Three maxima were found in the tracer concentrations, at 58.45, 59.519, and 60.535 GMT. Monitoring of the outfall plume was done similar to that of the inlet, from day 57.54 to 61.08 GMT, on the Coral Reef II and the Cable. Measurements are listed in Table 1. Ocean currents were measured by ADCP, and were generally northerly. The Experiment A dosing site was chosen on the south side and west of the highway overpass of the Boynton Inlet [FIigure1]. Dosing occurred during ebb tide (12:53 am to 7:43 am EST, 22-February) resulting in a pulse of tracer-containing fresh water exiting the inlet and entering the coastal ambient ocean. Dosing rates for both tracers were held nearly constant, The ratio RD[ppb]/SF6[ppb] was 22.9. Changes in the resulting concentration in the inlet waters was primarily due to changes in the flow rate through the inlet (measured by horizontally-directed ADCP). The tracers initially were confined to a ‘plug’ of water emerging from the inlet into the coastal ocean during the morning outbound tide of 22-February. Ambient ocean currents were measured during the time of the experiment by upward-directed ADCP instruments (map, Figure 2; currents Figure 3). It happened that a current reversal event occurred on the afternoon of the dosing day, which we believe had a significant impact on the plume. Otherwise, the currents were northerly at ~30 cm/s on the surface.. Insert: Map of Boynton Inlet, South Central outfall, and three bottom-mounted ADCP sites. Figure 1 The Boynton Inlet Figure 2. Current measurements. Discussion of Results An example of a zigzag excursion across the plume is shown in Figure 2. The plume is noted by concentration maxima (redder colors) running parallel to the shore. RD and SF6 presented similar views of the plume, although the lower resolution of the RD instrument was a limiting factor. From the data, 36 RD peaks and 129 SF6 peaks were selected (Figure 3). These data compared reasonably well (Figure 4) given the differences in detection limit and analysis time. Although the boil was not always easy to sample due to the ephemeral nature of the plume, initial dilutions of 20-100 were noted, in accord with Wanninkhof (2005), Table 2. Because of the varying concentration of the tracers emerging from the outfall, no dilution of the plume can be calculated; however, a generally linear decrease in concentration with distance is noted (Figure 5) In order to measure the vertical profile of tracers a different distances from the outfall, a series of seven “casts” were performed, wherein the seawater sampler was lowered to the bottom, then mid-depth, then surface. Exemplary data is shown in Figure 6 (left). On the right is the SF6 data at depth and surface, indicating that the concentration at the surface de- creased without evidence of downward movement of the tracer. At a distance of 8 km, the concentrations were equivalent. Some additional measurements were made. The acoustic backscatter image of the plume is shown in Figure 7. In Figure 8, results from the underway ammonium system are given; these data consistently showed that ammonium, elevated at the boil, rapidly decreased away from the boil. Satellite view of the Boynton Inlet, Palm Beach County, Florida. Tracers were introduced into the inlet waters at “X”. Figure 1. Outfall dosing. Table 1. Ship measurements. Equipment aboard the R/V Coral Reef IINamePurposeInvestigator gas chromatograph SF6 measurement K. Sullivan, D. Pierrot gas chromatograph NH4 measurement N. Amornthammarong seawater sampling nutrients J. Craynock towbody CTD seawater properties S. Cummings towbody fluorometer RD analysis S. Cummings bulk water sampler microbiology C. Sinigalliano Stick plot of currents measured at the GSR-S ADCP during the inlet study, days 53 through 56 (22-February through 24-February 2007). Dosing at the inlet took place on 22-February from 1:50 EST (6:50 GMT, 53.285) to 5:05 EST (10:05 GMT, 53.420) (black bar). Note current reversal day 53.7-54.3 Figure 2. Plume surveys. Figure 4 Plume surveys on the CRII. Figure 5. peak locations Figure 6. Two fragments of marked water (×,Δ) Top: Output of SC TWWP. Bottom: resulting concentrations of tracers at the dechlorination site (dotted line) and at the outfall (solid line). Concentrations varied because of changes in flow rate from the TWWP; three concen-tration maxima were noted. Ship Measurements The inlet plume was sampled by two ships, the commercial R/V Coral Reef II (CRII), and the NOAA R/V Cable. Sampling proceeded during February 22, 23, and 24, 20007. The Cable was used for discrete water samples, acoustic backscatter measurements, and current profiling by ADCP. Analyses performed on the CRII samples are shown in Table 1. For sampling, the CRII was typically driven in zigzagging traversals of the expected plume. Instrumentation was contained in a “towfish” pulled by the ship; the towfish had a water inlet from which water was pumped into the ship for analysis. Results from four of these traversals are shown (Figure 4). It was noted that a significant residual effect was noted in the SF6 analysis, where the instrument had an SF6 “memory” that persisted for several minutes (τ=8.6 min-1). To compensate, only the leading SF6 ‘peaks’ were used in the analysis. A total of 28 dye peaks and 38 SF6 peaks were noted. These are mapped in Figure 5. Data (left) and dot maps for dye (center) and SF6 (right) for “traversals” of the plume on 27Feb, days 58.3643-58.4937. Figure 3: Inlet dosing, instruments and results. Figure 5. Dye and SF6 concentrations Below are plotted the concen-tration of the off-boil tracer peaks versus distance from the outfall. Figure 3. SF6 and dye measurement locations Figure 4. Concentration ratios Ratio of RD to SF6 (upper); ratio versus distance (lower). Table 2. Initial dilutions Samples from the boil were analyzed for SF6 and compared with the concentrations estimated from calculated concentration. Results Overview In the first traversal (Figure 4 upper panel), the ship was traveling south. The plume was encountered on the two shoreward zigzags north of the Inlet, indicating that the plume was hugging the shore. The northernmost elevated tracer location was ~3.5 km from the inlet, which meant the water mass had moved at ~12 cm/s (consistent with the ADCP measurements); the southernmost elevated tracer location was only ~0.9 km from the inlet, ~0.9 cm/s velocity. It appeared that the original “plug” of tracer-containing water may have been split into two fragments and spread over ~2.4 km, perhaps from the southward alongshore current or from the current reversal noted above. A plot of the speed (distance traveled / elapsed time) parts, Figure 6, more clearly showed that the plume had been separated into two fragments. The two fragments were evidently affected differently by the nearby Gulf Stream, and were transported northward by the ambient current at different rates. Subsequent traversals (Figure 4) showed the plume remaining parallel to the shore, with the tracers slowly dissipating; the plume was observed nearly 30 km north, at 26°49’16”N near the Lake Worth Inlet (SF6 data). The concentrations of the two tracers were in generally agreement during the study (Figure 7 upper), but increasing with distance from the inlet (Figure 7, lower) presumably because the SF6 gas was off-gassing. Dilution of the plume was not the same for the two tracers (Figure 8). The linear dilution rate R (Dilution = R * distance[km]) was ~31 for SF6, but ~169 for the dye. A new shipboard system for ammonium [Zhang et al, 1997], using the flow-through water pumping system, was employed on the cruise. Many small variations in ammonium can be observed along the track north of the inlet (Figure 9). Measurements obtained during two zigzag “excursions” across the plume. Right-most panels are the concentration ranges are plotted as colored dots for RD, SF6, and salinity, and chlorophyll-a along the track line of the ship. For salinity, the red colors denote a concentration minimum; for the others, red denotes a maximum. Locations of the 37 sites where measurements were obtained, with the two fragments are denoted by x and ∆ . Left: Instrumentation. Right: Concentrations of dye (▲) and SF6 (♦) injected into the Boynton Inlet during the dosing period. Because the dosing flow rate was essentially constant, changes in the concentration in the Inlet reflect changes in the Inlet flow. The flow rate was measured by a side-looking ADCP. Figure 6. Cast Measurements Seven Cast experiments were performed on 27-Feb and 28-Feb, in which the “towfish” water sampler was lowered to near the sea floor (~15 m depth), then raised to mid-depth, and then at the surface, for several minutes at each depth. Data from one cast is shown in Figure 14. The ship drifted during the cast. The measurements were designed to determine downward motion of the surface plume. On the right is shown the SF6 concentration from the surface and at depth from all cast data. Note lack of evidence of downward movement of SF6. The concentration at the surface is the same as at depth at ~8 km down-current from the outfall. Figure 7. Acoustic backscatter image of plume. An acoustic backscatter instrument on the Coral Reef II obtained the below image of the SC plume. Note the rising column of positively-buoyant effluent, and the resulting plume on the surface. Figure 8. Seawater ammonium measurements. Figure 7. Dye/SF6 ratio Figure 8. Dilution with distance Ammonium was measured in seawater [Zhang et al., 1997]. Although high values were seen at the boil (~0.1 to 3 ppb), the concentration rapidly decreased away from the boil. Figure 9. Ammonium in seawater [Zhang et al, 1997]. This was the first application of an underway (flow-through) ammonium analysis instrument in this area. Summary and Conclusions • The effluent plume, from inlet or outfall, was carried generally northward with the ambient current but were transient, broken up, and meandered, • slowly dissipating into the receiving waters. Frequent current reversals (~15% of the time) contribute to plume disruption. • 2. The path of the plume, from inlet or outfall, ran roughly parallel to the shore. • 3. The outfall plume dissipated to the detection limit of the dye at ~8 km. • No evidence for downward mixing of the outfall plume was seen from 3-8 km down-current of the outfall. WEB: http://www.aoml.noaa.gov/themes/CoastalRegional/projects/FACE/faceweb.htm. NOAA / OAR / AOML / OCD