Download
1 / 21
210 likes | 401 Views
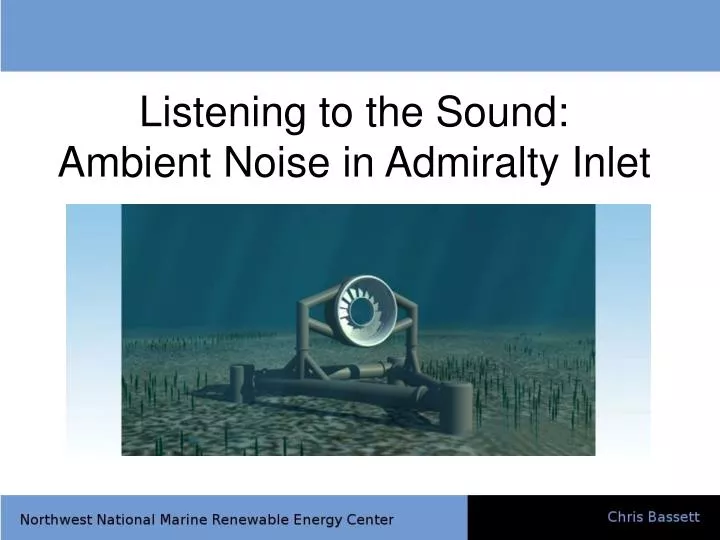
Listening to the Sound: Ambient Noise in Admiralty Inlet. Motivation. Study ambient noise and identify sources Results used by regulators in permitting process. Site. Admiralty Inlet b/w Port Townsend and Whidbey Island. Data Collection. Temporal Data -Three month sea

E N D
Motivation • Study ambient noise and identify sources • Results used by regulators in permitting process
Site • Admiralty Inlet b/w Port Townsend and Whidbey Island
Data Collection • Temporal Data -Three month sea spider deployments - Samples at 80 kHz. • Spatial Data • Deployment from R/V deck during cruises -Samples at 400 kHz
Typical Sources • G. Wenz, 1962 identifies typical sources of ambient noise in deep water • freq < 100 Hz: turbulent pressure fluctuations, seismic activity, explosions • 10 – 10,000 Hz: ships, industrial activity • 100 – 50,000 Hz: bubbles and spray, weather
Data Processing Basic Algorithm • Raw voltage data is tapered • FFT on tapered data • FFT output to power spectral density • Apply calibration curve • Ensemble averages
Recording Hydrophone Results • Spectra chosen to represent different acoustic conditions at the site.
Recording Hydrophone Results • Spectrograms combine data in from individual spectra into a time series. Other ship traffic Ferry crossings June 15th, 2009 Spectrogram
Recording Hydrophone Results • Sound Pressure Level (SPL) is obtained by integrating under the PSD curve June 15th, 2009 SPL Time Series
Recording Hydrophone Results • Cumulative Probability Density Function for May-August mobile hydrophone deployment
Recording Hydrophone Results • SPL and velocity time series data for May-August deployment
Recording Hydrophone Results • SPL and depth averaged velocity time series for May 25th
Recording Hydrophone Results • SPL vs. depth averaged velocity. Error bars represent two std. deviations. • Error bars represent two standard deviations.
Recording Hydrophone Results • Permanent Noise Levels for depth averaged velocity bins.
Mobile Hydrophone Surveys • Surveys taken in concentric circles around site at 0m, 500m, 1000m, 1500m, 2000m, and 2500m • Surveys taken a 3m, 25m, and 50m below the surface • Purpose is to search for patterns in spatial variations near the site.
Mobile Hydrophone Results • Selected spectra demonstrate different conditions: • Survey 10: Recreational boat near site (closest during 25m survey) - Survey 7: Quiet conditions
Mobile Hydrophone Results • Mobile hydrophone survey map
Conclusions • Stationary Hydrophone Surveys • Stationary surveys demonstrate clear dependence on tidal currents • Anthropogenic noise (ship traffic) also causes regular increases in spectral levels and SPLs • Mobile Hydrophone Surveys • Mobile hydrophones show no spatial patterns • High resolution spectra and notes taken during surveys demonstrate impact of known anthropogenic noise sources on the acoustic environment
Ongoing Analysis • Study impact of turbulent pressure fluctuations (psuedo sound) on recorded spectral levels - This is also called “flow noise” • Seasonal variations? • Use AIS to identify contributions from ship traffic
Ongoing Analysis • Study feasibility of using the recording hydrophone in detecting cetacean vocalizations Example Orca Vocalization Acoustic Release
Acknowledgements • Project funding provided by SnoPUD • Joe Talbert for his fantastic equipment engineering • Everybody in the CEE EFM lab • Dr. Thomson and Dr. Polagye