Download
1 / 17
170 likes | 376 Views
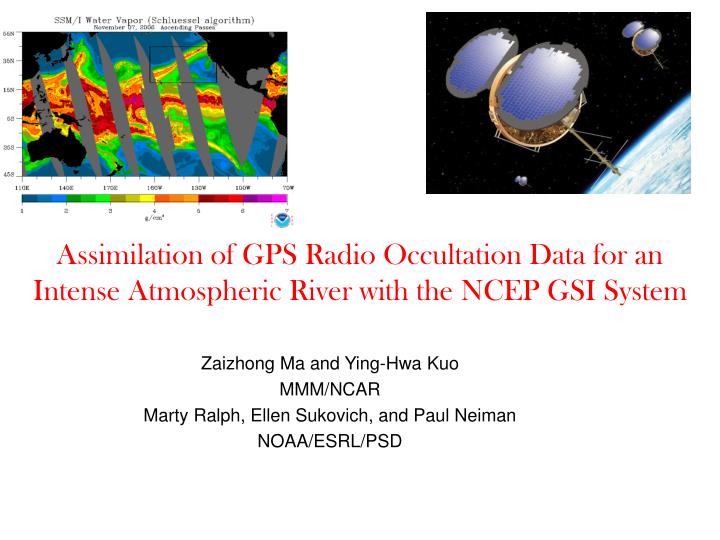
Assimilation of GPS Radio Occultation Data for an Intense Atmospheric River with the NCEP GSI System. Zaizhong Ma and Ying-Hwa Kuo MMM/NCAR Marty Ralph, Ellen Sukovich, and Paul Neiman NOAA/ESRL/PSD. Atmospheric River case: Nov 6-8, 2006. From Neiman et al. (2008).

E N D
Assimilation of GPS Radio Occultation Data for an Intense Atmospheric River with the NCEP GSI System Zaizhong Ma and Ying-Hwa Kuo MMM/NCAR Marty Ralph, Ellen Sukovich, and Paul Neiman NOAA/ESRL/PSD
Atmospheric River case: Nov 6-8, 2006 From Neiman et al. (2008)
Observed Daily Precipitation 24-h precipitation ending at 1200 UTC 7 November 2006 Flooding and debris flow on White River, Oregon
18 UTC 02 00 UTC 03 …………… 12 UTC 09 18 UTC 09 CTCL LOC NON Cycling experiments with 6-hr assimilation window from 3 to 9 Nov. 2006 …………… First-guess is AVN analysis First-guess is 6h WRF forecast First-guess is 6h WRF forecast First-guess is 6h WRF forecast Experiment Setup • System: NCEP Gridpoint Statistical Interpolation (GSI) + WRF ARW • Case: AR took place in the early of Nov.2006 • Setup: • Cycling Assimilation: 36km38L; Ptop: 50hPa • 24h Forecast: triple nested domain, 36x12x4km Three runs: • CTRL: operational observation data; • LOC: CTRL+GPS with Local operator • NON: CTRL+GPS with Non-local operator
GPS RO soundings for one week (Nov. 3-9, 2006) The distribution of GPS RO soundings with the time in each 3h cycling assimilation window.
PWV of analysis at 0600 UTC 07 Nov. 2006 SSM/I observation Non-Local analysis Local minus Non-Local
3h Forecast Verification in the Cycling Assimilation The 3-h WRF forecasts fit to GPS refractivity with time. The value is cost function for CTRL (blue), LOC (red) and NON-LOC (green) runs, respectively.
Standard Deviation and Bias of 3h forecast fit to GPS Refractivity The statistics of difference for the assimilation domain from 0000 UTC 03 to 1800 UTC 09 November 2006. Bias (left panel) and Standard Deviation (middle panel) errors of 3-h WRF forecasts verified against GPS RO refractivity for CTRL (dashed curve), LOC (thin curve) and NON-LOC (thick curve). The right panel shows the total number of verifying GPS soundings at each level during one-week cycling period.
GPS Impact on 24h WRF forecast 24h forecast starting from 1200 UTC 6, 3 domains nested. Assimilation on D1. D3 only covers Washington and Oregon states. D3 D2 D1
24-hr accumulative precipitation ending at 1200 UTC 7 Nov. 2006 OBS CTRL NON-LOC LOC
24h PWV Difference between LOC (or NON) and CTRL experiments LOC - CTRL NONLOC - CTRL
Bias and Standard Deviation of 24h forecast fit to GPS Refractivity
QPF and evaluation data • SITES • 50 sites in WA, OR, & CA (117” precip. total) • 22 sites in “wet” region (107” precip. total) • 28 sites in “dry” region (10” precip. total) Verification Region • DATA • 1200 UTC 6 Nov. to 1200 UTC 7 Nov. 2006 • Model quantitative precipitation forecast (QPF) • Forecasts made from 12 Z to 12 Z • Resolution of 4 km • Quantitative precipitation estimates (QPE) • From NWRFC • Gauge-based • 12 Z to 12 Z • Resolution of 4 km WA OR CA
Site Forecast and Observed Data “Wet” region sites “Dry” region sites
Observed precipitation at 50 evaluation sites Observed precipitation (inchesX100) 460 390 155 44 19 340 235 430 860 306 22 747 534 716 > 7 in/24h 570 5-6.9 in/24h 300 480 94 3-4.9 in/24h 303 0.16-2.9 in/24h 697 0-0.15 in/24h 140 Indicates “wet” region 524 257 03 52 1360 98 00 370 216 233 350 00 10 125 85 30 00 10 10 20 00 10 00 00 48 10 00 01
Nonlocal is best Indicates “wet” region Minor difference Control is best Comparison of QPF bias for forecasts with (“non-local”) and without (“control”) COSMIC data • * Numerical values represent difference between the two forecasts in inches, normalized by the total observed precipitation at that site. It is expressed as a percentage. • *Color fill represents which forecast had smallest bias: • green: COSMIC data improved the forecast • red: Control run without COSMIC is still best • yellow: Differences were minor • ***The COSMIC data improved the QPF at sites where the heaviest rain fell. • NOLOCAL performs better than LOCAL. [QPF (non-local) – QPF (control)]/observed X100% -01 -15 29 46 -02 05 -01 -10 12 00 26 -57 24 93 44 04 -14 -05 -16 -29 -25 -21
Summary and Conclusions • COSMIC GPS RO soundings successfully assimilated with NCEP regional GSI system using both local and nonlocal observation operators. • Assimilation of COSMIC data improved regional analysis and prediction of the atmospheric river event: • Better fit to independent observations • Nonlocal observation operator performs better than local observation operator: • Significantly reduces dry bias in precipitation forecast • improves QPF at sites where the heaviest rain fell • More case studies are needed to substantiate the results.