Download
1 / 12
120 likes | 567 Views
Introduction to Seismic Reflection Imaging: Pt 1. References: J.M. Reynolds, An Introduction to Applied and Environmental Geophysics, 1997. John Wiley & Sons, pp. 215-233 (NB missing from Killam Lib) O. Yilmaz, Seismic Data Processing, 1987. Soc. Exploration Geophys., Tulsa, OK.

E N D
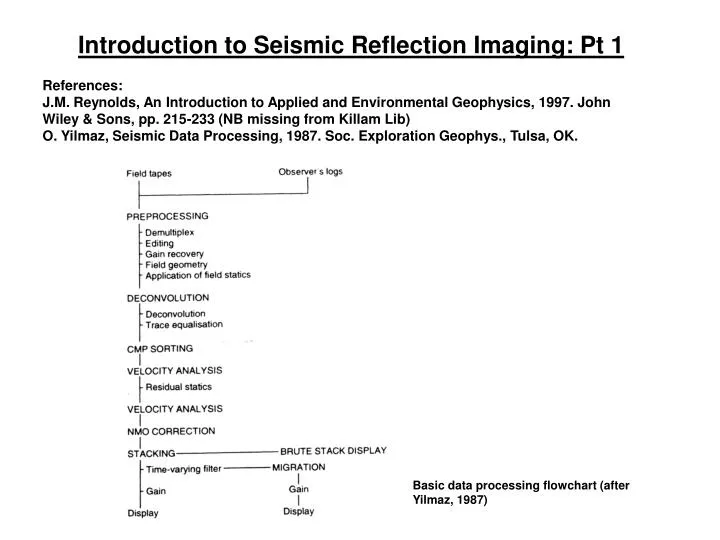
Introduction to Seismic Reflection Imaging: Pt 1 References: J.M. Reynolds, An Introduction to Applied and Environmental Geophysics, 1997. John Wiley & Sons, pp. 215-233 (NB missing from Killam Lib) O. Yilmaz, Seismic Data Processing, 1987. Soc. Exploration Geophys., Tulsa, OK. Basic data processing flowchart (after Yilmaz, 1987)
Very Basics of Seismic Reflection Imaging • What is meant by seismic? • Seismic vs Acoustic • Why not Electro-magnetic? • Reflections? • Why? • How? • What type of “image” are we trying to produce? • 1D vs 2D vs 3D vs 4D? • What determines how “good” is it?
Reflections in 1-D surface source receiver R z=0 Two-way travel time = (2*H)/V Units: m/(m/s) = s [more “typical” unit is ms] What determines resolution of “image”? What type of source? What type of receiver? What type of recorder? z=H reflector
R R R R R R R R R R R R R R 2-D Reflection Profiling surface dx z=H(x) What determines resolution of “image”?
Single Channel Profile • Source = airgun • Receiver = hydrophone = piezo-electric crystal that converts pressure variations into electric signals • Assume one source and one receiver located at same position behind ship Sea surface S/R Moves along profile r1,v1 Sea floor r2,v2 Layer 1 Fig. 1 Schematic of airgun shown in closed configuration (a) and after firing (b). r3,v3 Layer 2 Etc …
The Problem with airguns Examples of acoustic pulses produced by small to large airguns. A series of pulses follow the primary pulse due to the oscillation of the air bubble. The frequency of the bubble pulses are higher for small guns and lower for large guns. Thus by summing all the signals together, aligned at the primary pulse, we get a total signal in which the bubble pulse ringing has been reduced relative to the primary. This is referred to as a tuned airgun array.
Example of Single Channel Reflection Profile (including artifacts)
The Problem with Receivers • Reflections occur due to changes in acoustic impedance Z = r * v • Ar/Ao = {Z2-Z1}/{Z2+Z1} • Between sediment layers, changes in r and v are very small, ~ 1.7 to 1.75 m/s and 2.0 to 2.05 Mg/m3, so Z1,2 = 3.4,3.59 and Ar/Ao = 0.19/6.99 = 0.027 • So amplitude of reflections is very small relative to noise! • Solution = add more receivers and hope that noise does not add coherently
Why Do We Care? • Fig. 1 Sedimentary structures which produce oil traps. • Vertical section through anticline along line MN in (b); • (b) map of horizon A in (a); • (c) vertical section through fault trap along line XY in (d); • (d) map on top of bed B in (c); • (e) pinchout; • (f) unconformity trap; • (g) salt dome; • (h) limestone reef.
3-D Reflection Profiling A schematic illustration of 3-D seismic acquisition at sea, in which a single ship tows multiple hydrophone arrays and 2 groups of airguns. This allows imaging of sub-bottom reflections both along and across the arrays. A picture of a 3-D seismic vessel operated by Veritas. An example of 3-D seismic reflections plotted as a “data cube” showing two vertical and one horizontal sections through the data. Various 2-D images can be plotted from the data as series of 2-D depth (or time) sections or as horizontal sections at various depths (or time). In addition, horizontal sections can be produced in which an individual horizon is followed as it changes its depth.