Download
1 / 25
250 likes | 260 Views
Issues with FIA plot location confidentiality October 13, 2015 Demetrios Gatziolis Liz Burrill. Issues with FIA plot location confidentiality Imputation rasters (Demetrios Gatziolis) Urban FIADB (Liz Burrill). Current FIA policy:

E N D
Issues with FIA plot location confidentiality October 13, 2015 Demetrios Gatziolis Liz Burrill
Issues with FIA plot location confidentiality • Imputation rasters (Demetrios Gatziolis) • Urban FIADB (Liz Burrill)
Current FIA policy: • Make publicly available all hard (field collected) and soft (model based) at the individual plot level • Implemented through FIADB • Ensure that a one-to-one link between published data and ownership cannot be established • Believed to be addressed by altering (fuzzing) the true plot coordinates and, occasionally, swapping plots • Public coordinates were computed once. Precision adjustment have been made thanks to improving georeferencing technology
Requests to publish spatially explicit products • Vary in scope • Their objective evaluation • must consider previous releases and published data, and past changes in data protocols • requires substantial effort and expertise • may require repeated interactions with product authors • Set a precedent • Until recently they involved raster maps of a single continuous (e.g. volume, biomass) or discrete (e.g. species richness) variable • Imputation is the preferred technique for map generation
Raster imputation • Uses the attributes of a sample of objects, in our case plots, and ancillary information to establish relationships (models) • Many different types of models can be used. Near-neighbor is likely the most common. CARTs are gaining steam. • Relying on this relationship, explores the ancillary data at a given location to identify which plot is believed to be the most representative for that location. • It finally assigns a plot attribute (e.g. biomass) to that location, typically cell centers of a raster. • Imputation can be perceived as “landscape painting using a palette of FIA plots.” (Ken Pierce, Janet Ohmann, GNN pioneers)
Imputation rasters & spatial patterns Axiom of Geography: “Objects that are closer to each other tend to be more similar that objects that are further apart” By inference, two adjacent raster cells have elevated chances to have the same plot imputed on them Are there any implications from this phenomenon? • Spatial patterns • 1 FIA plot at ~ 3.1miles • Mean area “represented” by the plot has ~28,000 30x30 m cells • Expect plots to be imputed to a large number of cells, others to only a few
Imputation rasters & spatial patterns (cont.) Needle in a haystack 3,770,271 30x30 m cells
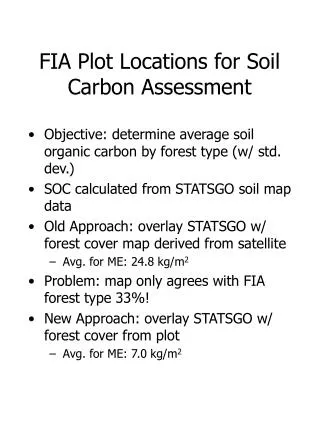
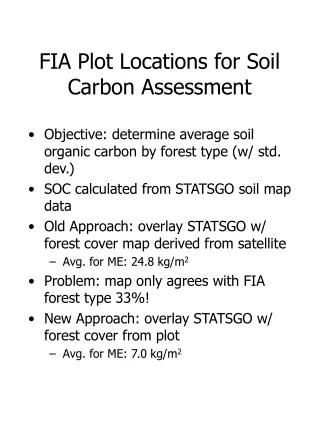
Imputation rasters & unique cell values • Excessive precision in imputed attributes • Too few sample plots • Imputed value that can be linked to a database • Tree lists • Token plot ID -> List of trees attributes (DBH, HT, SP) -> FIADB query -> unique FIADB plot -> public coordinates of the plot!
Imputation rasters & spatial patterns (cont.) From 3,770,271 30x30 m cells
Imputation rasters & spatial patterns (cont.) From 3,770,271 30x30 m cells to 25 30x30 m cells
Imputation rasters & spatial patterns (cont.) From 3,770,271 30x30 m cells to 25 30x30 m cells
Imputation rasters & spatial patterns (cont.) From 3,770,271 30x30 m cells to 25 30x30 m cells
Spatial Pattern Summary • Raster cell patterns for more than 10,000 plots from a single imputation across the western US were analyzed • The median of the Euclidean distance between centroids and the true locations was 40 percent smaller than the median distance between true and public locations. • For plots with pronounced imputed cell clustering, the median ratio was below 0.2. • A simplistic pattern centralization metric was used (centroid) • More complex, and likely smarter, cluster evaluation schemes can be devised
Urban FIADB and Coordinate Confidentiality • Information provided by Liz Burrill • The soon-to-be-published Urban FIADB will contain plot number, State, County, and fuzzed/swapped lat/long data, and it will be linked to FIADB • Unlike most forests, city boundaries are ephemeral, and often exhibit substantial meandering • Fuzzed coordinates proximal to boundaries can reveal the true plot location
UFIADB • Constraining fuzzing and swapping to within the urban boundaries is not a solution, thanks to frequent changes in the latter • Repeated fuzzing and swapping at plot revisitation compounds the problem by releasing multiple sets of coordinates for each plot • the plots must be uniquely identified through time for trend analysis • The magnitude of the problem is unknown. For Austin, TX – 9/250 fuzz/swap locations fall outside city boundary
UFIADB • Goal • Obfuscate location and owner while allowing meaningful analyses • Suggestions • Do not include (fuzzed) coordinates from the publicly datasets • Introduce a service that provides altered locations upon request. • A random location from a non-circular buffer around the true location would be selected, to avoid ‘central-tendency’ derivatives indicative of the true location • An online application (SIT/DATIM/?)would provide plot parameter summaries for user-specified polygons. • The application will observe the standard 250 acre, 3 owner rule. • No dot maps
FIA plot coordinates in Google Earth Engine • Submitted by Andy Lister • Technology • Using a web browser, overlay plots on terrabytes of satellite imagery stored on Google Servers • Using scripts written by Google and other contributors, perform image classification online like is currently done on PCs • Ability to efficiently, easily use FIA data for mapping, post stratification and other FIA business needs with very low overhead. • Issue • Requires unencrypted submission of plot coordinates over the internet to Google servers • Information used for analyses is stored in “server logs” that are accessible to Google staff, but not public
FIA plot coordinates in Google Earth Engine (cont.) • Proposed resolution • Submit multiple token (random) coordinates for every legitimate one, say in a 9:1 ratio. • Accept the risk that coordinate queries found in server logs will have no feasible links to specific FIA plots; any Google employee would have no idea of knowing the significance or validity of any coordinates in the logs.
Beyond Spatial Patterns • Vulnerability related to • Fusion of synthetic plots generated from FIADB data and derivatives of high-density LiDAR point clouds • Plot labels from overlays with NLCD rasters through time (e.g. 2006 Landcover, 2011 canopy, etc.) and information in Datamart. • Availability of automated spatial queries on a web interface • Vulnerability increases steadily with time. • How much risk, if any, is acceptable?