Download
1 / 33
330 likes | 342 Views
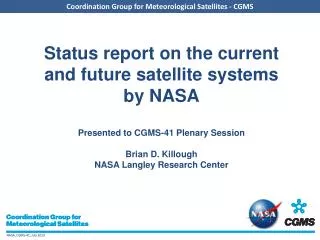
A report on current and future iceberg monitoring, modeling, and charting systems. Includes iceberg products, research, and industry organizations. Presented by Commander Gabrielle G. McGrath at the 6th Session of the Expert Team on Sea Ice in Helsinki, Finland.

E N D
Current and Future Iceberg Monitoring, Modeling, and Charting Systems A report from the IICWG Iceberg Subcommittee Gabrielle G. McGrath Commander, USCG International Ice Patrol 6th Session of the Expert Team on Sea Ice Helsinki, Finland 28 February 2017
Presentation Overview • Introduction – Connection between users & providers • Sample Iceberg Products From Ice services (handout available) • Research, Academic, and Industry Organizations • Future Activities
Introduction • Iceberg Information – Wide range of users with varying needs • Current products provide some combination of: • Iceberg Locations and Sizes • Iceberg Limit • Distribution and/or Concentration (density) • Drift History • Analyst Annotation • Tailored Iceberg Outlook
Introduction • Iceberg Information Users: • Operational • Iceberg avoidance – e.g., IIP customers • Iceberg managers – e.g., Oil and Gas Industry • Iceberg seekers – e.g., Tourists • Science and Research • Improving detection algorithms, drift and deterioration modeling • Assessing the role that icebergs play in understanding climate change • Are we addressing the needs of our users?
Arctic and Antarctic Research Institute Spatial Coverage – Iceberg Bulletins
Arctic and Antarctic Research Institute Northern Sea Route Iceberg Bulletins Icebergs
Arctic and Antarctic Research Institute Northern Sea Route Iceberg Bulletins • Product – Operational, weekly • Combined sea ice and iceberg chart • Icebergs indicated using WMO symbols with estimated quantity. • Region – Northern Sea Route – METAREAs XX & XXI • Purpose– Maritime Safety • Monitoring – Daily satellite with navigator reports as available • Manual detection for routine products • Automated CFAR detection with validation from ship navigators • Sentinel-1a,b (EW+IW) • Radarsat-2 (ScanSAR Wide, Quad Fine), • COSMO SkyMed (ScanSAR, HIMAGE) • Modeling – None
Canadian Ice Service Spatial Coverage - Ice Island Analysis
Canadian Ice Service Ice Island Analysis
Canadian Ice Service Ice Island Summary • Format – Non-operational, Monthly Summary of Ice Islands • Ice island designators indicating origin • Position and approximate areal coverage • Key imagery, photos, KML, and analyst notes • Region – Baffin Bay, Davis Strait, Labrador Sea • Purpose– Public Interest/ Research • Monitoring – Satellite: Radarsat-2 (DVWF, SCNA, SCNW); Sentinel-1 (EWS); Modis; photos (when available) • Modeling – None
Danish Meteorological Institute Spatial Coverage for Iceberg Products
Danish Meteorological Institute “Many icebergs and growlers located across the approaches Ilulissat due to release of icebergs on 30 August 2016 “Ice conditions continue to improve as icebergs drift towards north.”
Danish Meteorological Institute • Products/Purpose (Three total) • (1) Iceberg Concentration – Monitoring, Climatology • (2) Iceberg Reports – Maritime safety • (3) Approach outlook (commercial) – Maritime safety (cruise ships primary users) • Format/Region • NET CDF/ Greenland Waters (soon to be extended to 50N) • (2) Plain text, photo/ South Greenland inshore shipping lanes • (3) 1 page summary with illustrated graphics/ ice sensitive or hazardous Greenland straits or harbors • Monitoring –Aerial (Product (2) only) • Helicopter support for ice navigators (South Greenland inshore shipping lanes) • Satellite (All Products) with CFAR automated detection • Sentinel-1a & b (Interferometric Wide Swath) • Other high resolution imagery eg., Cosmo SkyMED when available • Modeling –None but expectations for next 24 hours provided for commercial product
North American Ice Service Spatial Coverage
North American Ice Service Daily Iceberg Limit and Distribution Aerial Satellite Reconnaissance
North American Ice Service Daily Iceberg Limit and Distribution • Format – Graphical chart & text bulletin • Purpose– Maritime Safety • Region– North Atlantic Ocean • Monitoring – • - Aerial • USCG HC-130J • PAL Aerospace (contracted by CIS) • Canadian Government, when available • - Satellite (north of 50°N) – Imagery analyzed in house • Radarsat-2 (ScanSAR Narrow, Wide Fine, Extra Fine) • Sentinel-1a,b (Interferometric Wide Swath) • TerraSAR-X (ScanSAR) and or Cosmo SkyMED when available • Modeling –IIP and NAIS Iceberg Drift and Deterioration Models are run twice daily in parallel; IIP Model currently used operationally.
Norwegian Ice Service Spatial Coverage Svalbard Hopen Met Station
Norwegian Ice Service Iceberg Alerts
Norwegian Ice Service Iceberg Alerts • Product – Non-operational, as required Iceberg Alerts • Iceberg from Austfonna Glacier, Svalbard • Key imagery, photos, and analyst notes • Region – Svalbard & Barents Sea • Purpose– Maritime Safety • Monitoring – Satellite with CFAR automated detection: • Sentinel-1a,b (EW+IW) • Radarsat-2 (ScanSAR Wide, Quad Fine), • COSMO SkyMed (ScanSAR, HIMAGE) • Some ground monitoring at Hopen Met Station, Svalbard • Modeling – Currently none (prior use of Canadian Hyraulics Centre (CHC) model), recently acquired NAIS Iceberg Drift and Deterioration Model
Iceberg Monitoring, Modeling, and Charting • Southern Hemisphere • Alfred Wegener Institute • Antarctic Climate & Ecosystems Cooperative Research Center (ACE CRC) • Arctic and Antarctic Research Institute • Argentine Naval Hydrographic Service • National Ice Center • Norwegian Ice Service
Argentine Naval Hydrographic Service Spatial Coverage - Weekly Iceberg Chart
Argentine Naval Hydrographic Service Weekly Iceberg Chart B15K
Argentine Naval Hydrographic Service Weekly Iceberg Chart • Product – Operational, weekly iceberg chart with daily METAREA and NAVAREA warnings • Depicts icebergs greater than 10 nautical miles with designator indicating origin • Includes area of icebergs and ocean currents • Region – Scotia Sea centered on South Georgia Island • Purpose– Maritime Safety • Monitoring – Daily satellite with reports from Argentine Navy and Antarctic stations as available • Manual detection only using: • MODIS • Sentinel-1a,b (EW+IW) • Radarsat-2 (ScanSAR Wide, Quad Fine), • COSMO SkyMed (ScanSAR, HIMAGE) • Modeling – None; will begin to use NAIS Iceberg Drift and Deterioration Model
National Ice Center Antarctic Icebergs 30 September 2016
National Ice Center Antarctic Icebergs • Product – Operational, weekly table of Antarctic Icebergs with designator indicating origin, location and size information. • Depicts icebergs greater than 10 nautical miles and those with areas greater than 20 nm2 with designator indicating origin • Information provided as CSV or PDF in tabular format • Region – Waters surrounding Antarctica • Purpose– Maritime Safety, Public interest • Monitoring – Daily satellite with reports from Argentine Navy and Antarctic stations as available • Manual detection only using: • MODIS • Sentinel-1a,b (EW+IW) • Radarsat-2 (ScanSAR Wide, Quad Fine) • Modeling – None
Research/Academia Glacial Ice Hazards Working Group Inaugural Meeting June 2015 – Carleton University, Ottawa https://wirl.carleton.ca/GIHWG/ • Centre for Arctic Resource Development (CARD) • Carleton University • C-CORE • Memorial University of Newfoundland (St. John’s) • National Research Council – Canada • Norwegian University of Science and Technology • European Space Agency/ Polar View – Polar Thematic Exploitation Platform • Princeton University • University of Ottawa
Industry • Monitoring / Modeling • Airbus Defense and Space (Terra SAR-X) • e-geos (COSMO Sky-Med) • MDA Corporation (Radarsat) • Oceans Ltd. • ASL Environmental Science • Ballicater Consulting • Ice Management • Amec Foster Wheeler • Canatec • Fednav • Horizon Ice • PAL Aerospace • Statoil • Suncor Logistics
Future Activities • Monitoring • Expansion of monitoring area in North Atlantic and other areas • Use of cloud-based data discovery, processing, and modeling (e.g., Polar Thematic Exploitation Platform) Iceberg Detection Forecasting Iceberg Trajectories
Future Activities • Modeling • NAIS Iceberg Drift and Deterioration Model validation and improvement • Use of modeling techniques to support probabilistic products • e.g., ensemble and Monte Carlo simulations Model Validation Using Actual Iceberg Drift
Future Activities • Charting • Incorporating proposals for portrayal of iceberg information • Providing charts in ECDIS format • Developing probabilistic products USCG Search and Rescue Optimal Planning System