Download
1 / 12
120 likes | 122 Views
Explore the latest advancements in geophysical fluid dynamics and ocean circulation through satellite altimetry and other observing technologies. Discover the global observing system for the oceans and the reconstruction of the time-mean circulation.

E N D
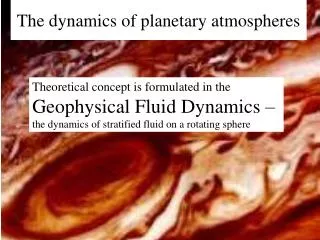
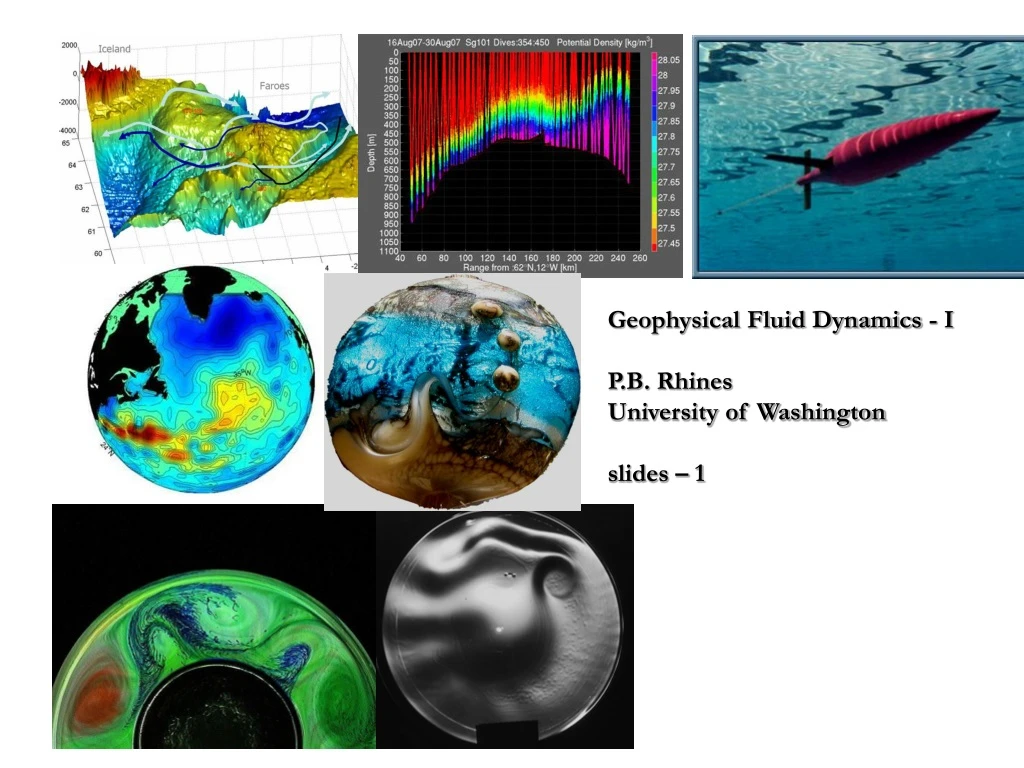
Geophysical Fluid Dynamics - I P.B. RhinesUniversity of Washington slides – 1
Gale force winds were supplied by fast-moving lows arriving from the Great Lakes, where a deep trough in the jetstream was stationary for some days. Three hurricanes reached Greenland in the 4 weeks prior to launch, energizing when they passed beneath the jetstream
temperature at 850 HPa: cold air outbreaks sweep southward from the Arctic
Ocean observations: circulation models, observations, lab experiments have reached a new level of accuracy…and actually can now talk to one another! • Within the last 5 years we have, for the first time, a global observing system for the oceans, based on satellite altimetry (later SWOT) (currently two US satellites and EU satellites), surface drifting buoys and ~ 3000 subsurface drifting ARGO floats. • In addition, observations with new technologies are targeting special regions: robotic gliders, smart profiling moorings, RAFOS floats, articulate chemical tracers (purposefully introduced (SF6, and inadvertant (tritium, CFCs, 129I))
Satellite altimetry, with a repeat cycle of typically 10 days for each satellite, gives us synoptic (time-resolved) observations of the ocean surface elevation, hence subsurface pressure, hence geostrophic circulation. It does not see the time-averaged pressure associated with the time-mean circulation but this background field is more and more accurately being reconstructed. In part the GRACE twin gravity satellites which are doing this, but there are many other strong constraints (surface drifting buoys, hydrography) being applied. Thus you do not see the great ocean gyres and jets of the time-mean. These mean fields are shown in a later slide. Below we see a snapshot of the global sea-surface elevation, part of an animation from 1992 to present. A single satellite resolves coarsely, two satellites more finely, the large-length-scale end of theenergy-containing eddy spectrum The dimples and pimples march westward almost everywhere on Earth. The only significant eastward propagation is seen in the Antarctic Circumpolar Current (the greatest of all ocean currents, in the Southern Ocean. Even the eastward-flowing Gulf Stream and Kuroshio jets fail to force much eastward phase progression (they are ‘rivers meandering’ eastward). Chelton et al. 2007 Geophys Res. Lett.
Erika Dan section (temperature) 60N (Worthington-Wright Atlas)
contours of the Earth’s geopotential field,Ф (gravity and centrifugal effects), for a point-mass approximation to gravity. The maximum
rotation vector equatorial plane km km Earth’s geopotential field, Φ