Download
1 / 29
290 likes | 290 Views
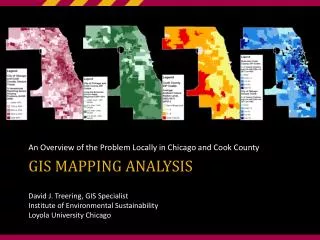
Learn how to create effective and visually appealing maps with GIS mapping techniques and best practices. Understand design objectives, color choices, scale, and map elements to make the most of your GIS mapping projects.

E N D
Making the most of GIS mapping You can spend a week analyzing a project and destroy the results with a bad map.
Maps “A map is a representation, normally to scale and on a flat medium, of the selection of material or abstract features on, or in relation to, the surface of the Earth.” (International Cartographic Assoc.)
Design objectives Manipulate the graphic characteristics Fulfill the intended purpose You have several objectives • Map objectives • Share information • Highlight relationships • Illustrate analysis results
How are you representing reality? Is a single center line more appropriate than the curb line?
Scale is very important • What is the purpose of the map? • At 1:250,000, a 7mm pencil line for a road or stream represents 574 ft. • At 1:24,000, a 7mm pencil line is equivalent to 7.87ft.
Mode of Use Travel map Wall Map
General maps Topographic maps Show locations Variety of uses Thematic Maps Distribution of an attribute Attribute relationships There are different map types
You use different design techniques to accomplish different objectives.
The Good, the Bad and the downright Ugly. You can easily avoid making a really ugly map by following some basic map making guidelines. By the way, its usually very easy to spot a novice map maker – bright colors and lots of it, or too many things on the page.
Color makes a very big difference. The darker shades, in this case, represent higher values.
Intense, primary colors are hard on the eyes and do not attract serious attention. Save it for your T-shirts.
When you make a color map, it is a good idea to print it out in Black and White to see how it looks. Very often your map is going to be copied for wider distribution.
If you are not happy with ESRI color ramps, you can create your own. Choose the colors you want for both ends (double click) Then Click Sym and choose Ramp Colors.
The eye cannot typically see more than 7 shades of gray. In reality, we have a hard time with more than 5 shades.
Consider polygon shading but be cautious because it can become very “busy” and hard to read. Many journals require B&W maps for reproduction.
Neat line Graticule / Grid North Arrow Legend Title Verbal Scale? Index map Date Author Pertinent Meta Data Scale Bar Representative Fraction (RF) Map Elements