Download
1 / 8
80 likes | 329 Views
Developing Risk of Mortality and Early Warning Score Models using Routinely Collected Data. Healthy Computing Seminar Tessy Badriyah 22 May 2013. Developing Risk of Mortality models.

E N D
Developing Risk of Mortality and Early Warning Score Models using Routinely Collected Data Healthy Computing SeminarTessy Badriyah22 May 2013
Developing Risk of Mortality models • We used the Biochemistry and Haematology Outcome Model (BHOM), the fields are haemoglobin, white cell count, urea, serum sodium, serum potassium, creatinine, urea / creatinine. We developed risk of mortality model using Logistic Regression. Assessing a performance of using calibration (the 2 test or chi-test) and discrimination (area under ROC curve or c-index). • We focus on using decision trees as the potential method and then we compare their performance with that of logistic regression. • We also consider some techniques in machine learning (LR, DT, NN, NB, SVM, KNN) in order to find alternative methods to predict risk of mortality. • We conducted experiments to assess the stability of the models by using a 10-cross validation method. We use t-test statistics to assess models from cross validation. • We also propose a new measurement, exhaustive method, to assess the performance of the method for predicting risk of mortality.
New proposed measurement performance : Exhaustive Method Algorithm 3.5 : Exhaustive method to asses performance of the model 1: for A=1 to number of records do, 2: for B=1 to number of records do, 3: % If index of A not equal index of B, compare the risk and outcome 4: if (A not equal B) then 5: % If risk of A greater than risk of B 6: if (risk(A)>risk(B) AND outcome(A)=dead AND outcome(B)=alive) then 7: success=success+1 8: % If risk of A less than risk of B 9: elseif(risk(A)<risk(B) AND outcome(A)=alive AND outcome(B)=death) then 10: success=success+1 11: % If outcome of A equal outcome of B 12: elseif(outcome(A)=outcome(B) then 13: ; // don’t do anything 14: % otherwise (if not satisfied all above condition) 15: Else 16: fail=fail+1 17: End if 18: End if 19: End for 20: End for 21: Discrimination = success / (success+fail).
Comparison between Decision Trees and Logistic Regression and other machine learning techniques
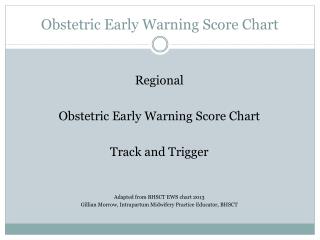
Develop early warning score models A new proposed method : DTEWS If (pulse<39) then score=3 Elseif (pulse>=39 and pulse<47) then score=1 Elseif (pulse>=47 and pulse<90) then score=0 Elseif (pulse>=90 and pulse<101) then score=1 Elseif (pulse>=101) then score=2 Vital sign dataset (n = 198,755 observation sets). 7 fields in the dataset : heart rate, respiration rate, systolic blood pressure, body temperature, neurological status, peripheral oxygen saturation (SpO2) and inspired oxygen concentration
The Score VIEWS DTEWS