Download
1 / 23
230 likes | 331 Views
Southern Willamette Valley 2009 Long-Term Groundwater Monitoring Results – Part 2. And the Results, Please. 2009 15 Domestic Wells 10 decreasing 2 steady 4 increasing 24 Monitoring Wells 10 decreasing 6 steady 7 increasing 1 no show. 2008 17 Domestic Wells

E N D
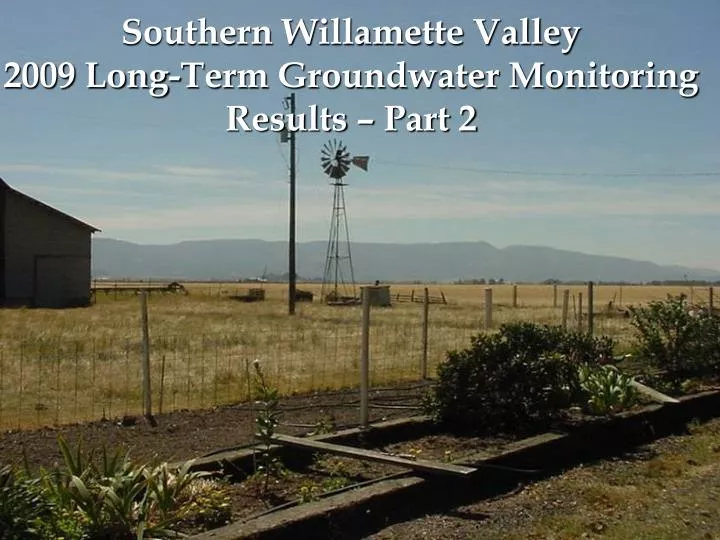
Southern Willamette Valley 2009 Long-Term Groundwater Monitoring Results – Part 2
And the Results, Please 2009 15 Domestic Wells 10 decreasing 2 steady 4 increasing 24 Monitoring Wells 10 decreasing 6 steady 7 increasing 1 no show 2008 17 Domestic Wells 4 decreasing 8 steady 5 increasing 24 Monitoring Wells 7 decreasing 7 steady 9 increasing 1 no show
And the drum rolls • Average Nitrate Value 1st 9 Events for all GW wells = 5.37 mg/L
And the drum rolls • Average Nitrate Value 1st 9 Events for all GW wells = 5.37 mg/L • Average Nitrate Value for 1st 9 Events for all DW Wells = 4.94 mg/L
And the drum rolls • Average Nitrate Value 1st 9 Events for all GW wells = 5.37 mg/L • Average Nitrate Value for 1st 9 Events for all DW Wells = 4.94 mg/L Last Year of GW Monitoring Ave = 5.05 DW Monitoring = 4.75