Download

1 / 20
200 likes | 381 Views
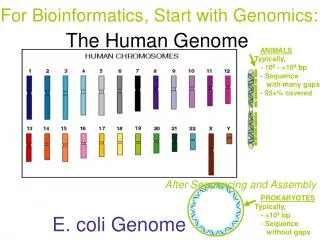
Prodigiosin Production in E. Coli. Stephanie Vondrak Brian Hovey. Review. Our goal was to clone the pigI gene from Serratia marcescens into E. Coli Just to review: Prodigiosin is a secondary metabolite of various strains of Serratia , and other Gram negative gammaproteobacteria .

E N D
Prodigiosin Production in E. Coli Stephanie Vondrak Brian Hovey
Review • Our goal was to clone the pigI gene from Serratiamarcescens into E. Coli • Just to review: • Prodigiosinis a secondary metabolite of various strains of Serratia, and other Gram negative gammaproteobacteria. • It is responsible for the red pigment produced by Serratiamarcescens. • Produced under the control of 14 genes(pigA-pigN) • We chose prodigiosin because of the recent attention to its newfound benefits • Benefits such as: antibacterial, antifungal, antiprotozoal, antimalarial, immunosuppressive, and anticancer properties
Review Gene of Interest • - We chose pigI because it is involved in one of the beginning pathways of MBC(4-methoxy-2,2`-bipyrrole-5-carbaldehydе) • - This is a precursor of prodigiosin
Review • Experimental Approach: • Growth of S. marcescens • Extraction of DNA • PCR Amplification of gene of interest • Site directed mutagenesis • Insertion of gene of interest into vector • Transformation of vector into E. Coli • Selection of vector through Arabinose activation and ampicillin • Check for gene of interest in vectors taken up byE.Colivia SDS-PAGE or sequencing
Growth of S. marcescens • S. marcescensculture obtained from Dr. Walter • Grew on a streak plate to see if culture was viable • Culture then grown overnight in LB at 37°C • Flasks were quite turbid so we proceeded to DNA extraction
Extraction of DNA • DNA was first extracted according to protocols obtained from the USDA • Amounts were reduced by a factor of 10 or more in most cases (Ex: 500ml to 5ml) • Potential DNA (at least protein) was precipitated • DNA samples ran through simple gel electrophoresis • Digested and undigested samples run • We assumed that these bands represented DNA because a streak showed up in a digestible lane (lane 7) • We proceeded to PCR amplification to confirm the presence of DNA (and our target gene)
PCR Amplification • On our first PCR run, the positive control failed, so we couldn’t conclude anything from our results • Temperatures: • Lane 3 – Biobrickoligo control • Lane 4 – No Biobrickoligo control • Lane 5 – Marker • Lane 6 – Biobrick 50 C • Lane 7 – Biobrick 52.9 C • Lane 8 – Biobrick 62 C • Lane 9 – Nobiobrick 50 C • Lane 10 – Nobiobrick 52.9 C • Lane 11 – Nobiobrick 62 C • Lane 12 – Marker • Annealing time – 1 min 30 sec Positive Control (or lack thereof)
DNA Concentration • After consulting with Dr. Schwekendiek, we noticed that our DNA may have been over diluted (we had our samples suspended in 1ml of solution, when Dr. Schwekendiek noted 100µl was the usual dilution) • To rectify this, we concentrated our DNA in a Speed Vacuum Concentrator overnight • After running our samples through the Speed Vacuum Concentrator, we ran them through simple gel electrophoresis • Sample 3 (lane 5) was the only sample that showed up in with any significant brightness, so we only used that sample for testing for the rest of our experiments (with our first extraction)
DNA Confirmation • - Only sample 3 produced visible bands and we wanted to confirm the presence of DNA, so we ran a undigested and digested sample 3 through simple gel electrophoresis - As you can see, the gel was faulty, but we decided that there was a clear enough distinction between undigested and digested to proceed to PCR confirmation Sample 3
DNA Confirmation • Our positive control worked (4th lane from the left), but our samples (lanes 5 and 6 from the left) did not display the expected brightness. It is important to note that our annealing time was only 1 minute 30 seconds and our target gene is 1473 b.p., so that may have an effect on our results. • We decided to run PCR again to see if the annealing time had an effect on our outcome • Annealing time = 1 min 30 sec • Lane 2 – Marker • Lane 3 – Negative Control • Lane 4 – Positive control • Lane 5 – Bio (Sample 3) 50 C • Lane 6 – NoBio (Sample 3) 50C
DNA Confirmation • - An hour after we started our second PCR run, we discovered that we incorrectly set our PCR cycle order, stopped it, fixed the protocols and ran it again. Annealing time = 3 minutes Lane 3 – Marker Lane 4 – Pos control Lane 5 – Neg Control Lane 6 – Sample 3 Bio 55C Lane 7 – Sample 3 NoBio 55C Lane 8 – Sample 3 Bio 58.7 C Lane 9 – Sample 3 NoBio 58.7 C Lane 10 – Sample 3 Bio 65 C Lane 11 – Sample 3 NoBio 65 C • Our positive control failed, so we were unable to draw any conclusions about the quality of our DNA • We decided that while we could confirm these results by running another simple gel electrophoresis, we felt that the DNA obtained through the USDA extraction protocols was faulty, so we prepared for another DNA extraction using protocols from Open WetWare
DNA Extraction • We grew up another culture from a set of streak plates provided by Dr. Walter • We extracted DNA from this culture using Open WetWare protocols and then ran it through simple gel electrophoresis • We had no visible bands • We suspected this is because we didn’t let our DNA properly dissolve in solution at the end of extraction, due to rushing to electrophoresis • We decided to run another gel electrophoresis after we let the DNA fully dissolve
DNA Confirmation • - The results of our gel electrophoresis (undigested and digested samples were run) were as follows: - These results correspond with digestible DNA, so we took what we determined to be the best sample (sample 2) and ran it through PCR
DNA Confirmation • Annealing time = 3 minutes • Temperatures • Lane 9 – Marker • Lane 10 – Positive control • Lane 11 – Neg Control • Lane 12 – NoBio 55 C • Lane 13 – Bio 55 C • Lane 14 – NoBio 58.7 C • Lane 15 – Bio 58.7 C • Lane 16 – NoBio 65 C • Lane 17 – Bio 65 C • Lane 18 - Marker • The results show a strong band at around 1500 b.p., which corresponds to the size of our target gene (pigI)
Experimental Approach Alteration • We decided that because time was limited we would alter our experimental protocol as follows: • Growth of S. marcescens • Extraction of DNA • PCR Amplification • DNA Purification • T-Vector Ligation • T-Vector Transformation • Growth of Transformed Cells (DH5α) • Plasmid Extraction • DNA confirmation • Sequencing We are here at this point
DNA Purification • Since the PCR showed bright bands at the range our target gene should be at (~1500 b.p.) we excised the DNA from the gel and purified it with a GeneJet Gel Extraction Kit • We then ran the DNA through a simple gel electrophoresis - We had bright bands show up at around 1500 b.p. again, so we felt confident that our target gene had been successfully purified
T-vector ligation and transformation • We proceeded to T-vector ligation with our target gene using a pGEM-T Easy Vector kit • We then add DH5α (E. coli) to the ligated T-Vectors and grew the solution on ampicillin plates to find potentially viable colonies • Our results were: • 3Amp: 2 colonies (only one was present at the time of picking) • 2Amp: 0 colonies • 1Amp: 0 colonies • +Amp: 20 colonies • -Amp: 0 colonies • -NoAmp: plate completely covered. • 5 colonies from the positive control and the one colony from Amp 3 plate were picked and incubated in 5ml of LB overnight • Growth was observed in all tubes
Plasmid Extraction and DNA Confirmation • We used a GeneJet Plasmid MiniprepKit to extract the plasmid from the DH5α cells • We then ran this through gel electrophoresis • We have a bright band at approximately 3000 b.p. which corresponds to the size of our vector (~3200 b.p.) • We did not notice a band for our target gene, but we sent it off for sequencing confirmation
DNA Sequencing • - Our results came back Tuesday - Comparing the pGEM T-Easy Vector sequence to our sequenced PCR showed that the sequences were identical – there was no sign of our target gene
References • Neil R. Williamson, 1 Henrik T. Simonsen, 2 Raef A. A. Ahmed, 2 Gabrielle Goldet, 2 Holly Slater, 1 Louise Woodley, 1 Finian J. Leeper 2 and George P. C. Salmond 1 *. "Biosynthesis of the Red Antibiotic, Prodigiosin, in Serratia : Identification of a Novel 2-methyl-3-n-amylpyrrole (MAP) Assembly Pathway, Definition of the Terminal Condensing Enzyme, and Implications for Undecylprodigiosin Biosynthesis in Streptomyces." (n.d.): n. pag. Print. • SerratiaMarcescens., 2011. Web. 3 Sept. 2012. www.serratiamarcescens.net • http://microbewiki.kenyon.edu/index.php/Serratia_marcescens • Harris, A. K. P. "The Serratia Gene Cluster Encoding Biosynthesis of the Red Antibiotic, Prodigiosin, Shows Species- and Strain-dependent Genome Context Variation." Microbiology 150.11 (2004): 3547-560. Print. • Williamson, Neil R., Peter C. Fineran, TamzinGristwood, Suresh R. Chawrai, FinianJ. Leeper, and George PC Salmond. "Anticancer and Immunosuppressive Properties of Bacterial Prodiginines." Future Microbiology2.6 (2007): 605-18. Print.