Download

1 / 17
180 likes | 276 Views
Ferrichrome. Vitamin B12. FhuA. BtuB. BtuF. FhuD. FhuB/C. BtuC/D. Nutrient Transport in E. coli. Passive transporters : Most nutrients < 600 Da - Porins Ligand Gated Porins - sugars

E N D
Ferrichrome Vitamin B12 FhuA BtuB BtuF FhuD FhuB/C BtuC/D Nutrient Transport in E. coli Passive transporters : Most nutrients < 600 Da - Porins Ligand Gated Porins - sugars Active transporters : Larger nutrients such as iron and cobalamin (vitamin B12 : CNCbl) BtuB, FecA, FhuA, and FepA etc.
Extracellular Space CNCbl CNCbl A B C D A BtuB Outer Membrane CNCbl Ton box CNCbl Periplasmic Space TonB DmH+ ExbB Inner Membrane ExbD Cytoplasmic Space Proposed TonB Dependent Transport Cycle
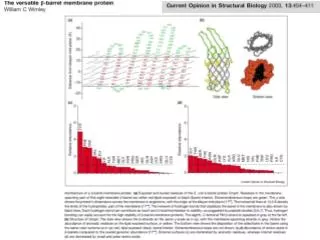
EPR Spectra for 2 consecutive strands of the barrel Fanucci et al. Biochemistry, 41, 11543, 2002
Accessibility is measured via Relaxation Measurements Strategy: Add a paramagnetic species that can collide with spin label ~ relative enhancements in relaxation times Enhancements in relaxation due to paramagnet tell you about collisional frequency and hence accessibility • Pulsed EPR - direct T1 measurements • Vs • Continuous Wave Power Saturation - indirect T1 measurements
metal membrane P1/2 = 19.1 met oxygen oxy P1/2 = 10.6 nit P1/2 = 5.6 Sqrt (P) A Poxy = P´1/2oxy - P´1/2nit accessibility Pmet = P´1/2met - P´1/2nit Nitroxide Accessibility and Membrane Depth from EPR Power Saturation of the EPR Resonance F = ln (DP1/2oxy/DP1/2metal) A = I•P1/2 •[1 + (21/e - 1)P/P1/2]-e
5-DOXYL +1.5 8.1 7-DOXYL +2.1 10.5 10-DOXYL +2.4 14.0 12-DOXYL +2.8 16.0 bR109R1 +2.2 11.0 bR116R1 +4.1 20.5 bR117R1 +4.2 22.5 bR124R1 +2.0 10.5 F Distance Sample Calibration Points: bR and DOXYL-PC PDB ID: 1ap9 Frazier, A.A. et al. Biochem, 42 (2003), 96-105
C2 domain doxyl-PC bacteriorhodopsin 229 142 171 240 239 202 170 201 197b 176 231 237 233 173 236 175 199 197 234 174 Modeling of C2A on the Membrane Surface Frazier, A.A. et al. Biochem, 42 (2003), 96-105
Ni(II)EDDA ca. 14 Å Ni(II) BtuB as a Ruler From the Bilayer Surface DOGS-NTA-Ni
Ni(II)EDDA ca. 14 Å Ni(II) BtuB as a Ruler From the Bilayer Surface F = ln (DP1/2oxy/DP1/2metal)
Ni(II)EDDA SDSL “Rulers” C2A CPLA2 ~ 14Å DOGS-Ni-NTA O2 BtuB KcsA bR POPC + BMP GM2AP ~ 2Å A60 Conclusions Lipid Composition Affects Binding GM2AP oligomerization
P a-helix bundle membrane aqueous phase b-barrel P membrane membrane aqu 2 2 4 4 6 6 8 8 Secondary Structure Analysis: Spin Label Mapping Transmembrane Water Filled Pores accessibility oxygen metal complex oxygen metal complex
aqueous phase membrane membrane aqu Power Saturation of EPR Spectra for 2 consecutive putative strands of the b-barrel b-barrel 26 of 36
Residue F F membrane aqueous Residue Power Saturation of EPR Spectra for 2 consecutive putative strands of the b-barrel Fanucci et al. Biochemistry, 41, 11543, 2002 27 of 36
Side View Bottom View S1 (25-31) Tonbox (6-12) Extracellular Lipid Bilayer extended tonbox (13-17) Periplasmic Structure of BtuB • 66 kD protein • beta barrel of 22 antiparallel strands • globular hatch/core domain Chimento et al.NSB 2003 (10) 394-401 7 of 20