Download
1 / 52
520 likes | 620 Views
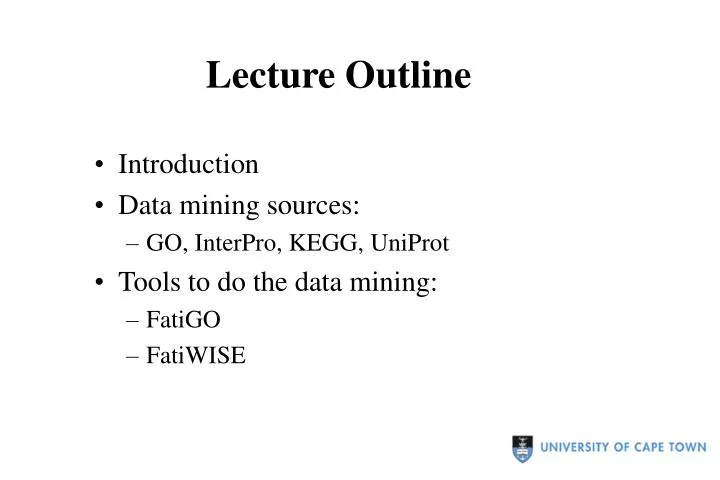
Lecture Outline. Introduction Data mining sources: GO, InterPro, KEGG, UniProt Tools to do the data mining: FatiGO FatiWISE. Data mining Microarray results. Microarray experiments are done to answer a biological question

E N D
Lecture Outline • Introduction • Data mining sources: • GO, InterPro, KEGG, UniProt • Tools to do the data mining: • FatiGO • FatiWISE
Data mining Microarray results • Microarray experiments are done to answer a biological question • Results generate sets of numbers (intensities) which are then clustered to find data points of interest • These themselves don’t necessarily answer the research question, these need to be converted to biological information first
Purpose of data mining • Validation of results –understanding why these genes are grouped together • Using biological information to find significant associations of biological terms to sets of genes • Understanding of the roles of the genes at the molecular level
Data mining (1) Add gene identifiers -AB02387 -SB07593 -AA00498 -AC008742 -AB083121
Data mining (2) Add gene descriptions -RNA polymerase -Glycosyl hydrolase -Phosphofructokinase -Transcripiton factor -Glucose transporter -AB02387 -SB07593 -AA00498 -AC008742 -AB083121
Data mining (3) Add GO terms -RNA polymerase -Glycosyl hydrolase -Phosphofructokinase -Transcripiton factor -Glucose transporter -AB02387 -SB07593 -AA00498 -AC008742 -AB083121 -GO0003456 -GO0006783 -GO0142291 -GO0054198 -GO0000234
Data mining (4) -AB02387 -SB07593 -AA00498 -AC008742 -AB083121 -GO0003456 -GO0006783 -GO0142291 -GO0054198 -GO0000234 -RNA polymerase -Glycosyl hydrolase -Phosphofructokinase -Transcripiton factor -Glucose transporter Add functional annotation
Data mining (5) -AB02387 -SB07593 -AA00498 -AC008742 -AB083121 -GO0003456 -GO0006783 -GO0142291 -GO0054198 -GO0000234 -RNA polymerase -Glycosyl hydrolase -Phosphofructokinase -Transcripiton factor -Glucose transporter Store results in database Map onto pathways
Sources of biological information • Free text: e.g. Medline • Using text processing tools • Curated repositories: e.g. GO, KEGG, UniProt, InterPro etc. • Using data mining • Using tools e.g. FatiGO and FatiWISE
Free text mining • Advantages: • Vast amounts of data • Many associated terms for each gene • Disadvantages: • Synonyms and acronyms • Context information • Irrelevant terms • Need to divide into entities and relationships to structure text
Example of problems The Sch9 protein kinase regulates Hsp90-dependent signal transduction activity in the budding yeast Saccharomyces cerevisiae. This interaction was suppressed by decreased signaling through the protein kinase A (PKA) signal transduction pathway. Text is unstructured –needs to be divided into entities and relationships
Example of problems Protein Verb Pathway The Sch9 protein kinase regulates Hsp90-dependent signal transduction activity in the budding yeast Saccharomyces cerevisiae. This interaction was suppressed by decreased signaling through the protein kinase A (PKA) signal transduction pathway. Organism Acronym –could be used elsewhere for different gene Negative term used Some problems overcome using stats & better detection of entities and relationships
Curated repositories • These have reliable annotation • Annotation is standardised • They are usually well structured • However, they usually have less annotation • Examples: GenBank, GO (FatiGO),UniProt, InterPro, KEGG (FatiWISE)
Gene Ontology (GO) • http://www.geneontology.org • Many annotation systems are organism-specific or different levels of granularity • GO introduced standard vocabulary first used for mouse, fly and yeast, but now generic • An ontology is a formal specification of terms and relationships between them
GO Ontologies • Molecular function: tasks performed by gene product –e.g. G-protein coupled receptor • Biological process: broad biological goals accomplished by one or more gene products –e.g. G-protein signaling pathway • Cellular component: part(s) of a cell of which a gene product is a component; includes extracellular environment of cells –e.g nucleus, membrane etc.
“is-a” e.g. mitochondrial membrane is a membrane • “part of” e.g. nuclear membrane is part of nucleus GO relationships DAG structure
Current Mappings to GO • Consortium mappings -MGD, SGD, RGD, FlyBase, TAIR • GOA (Gene Ontology Anotation): • Swiss-Prot keywords • EC numbers • InterPro entries • Manual mappings • Unigene • Medline ID mappings, etc. FatiGO Evidence codes NB
GO Slim • “Slimmed down” version of GO ontologies • Selection of high level terms covering all or most biological functions processes and cell locations • Many different GO Slim’s available with different depths and detail • Used to make comparisons between annotated gene/protein sets easier (each gene may be mapped to different granularity)
UniProt annotation • Protein sequence database from EMBL translations and direct sequencing • Structured into specific fields e.g. description, comments, feature table, keywords • Each field may have controlled vocabulary or specific syntax • Swiss-Prot is well annotated, TrEMBL is not, and may have less structured text
Example Swiss-Prot entry Annotation
KEGG • Kyoto Encyclopedia of Genes and Genomes • Molecular interaction networks in biological processes -PATHWAY database • Genes and proteins -GENES/SSDB/KO databases • Chemical compounds and reactions -COMPOUND/GLYCAN/REACTION databases • Includes most organisms and info on orthologues
InterPro • Integrates protein signature databases e.g. Pfam, PROSITE, Prints etc. • Classifies proteins into families and domains and lists all UniProt proteins belonging to each • Provides annotation on the family/domain and links to 3D structure, GO, Enzyme Classification • Used to functionally characterise a protein
FatiGO • Connecting microarray results with these biological data sources –answers questions e.g do my differentially expressed genes have different functions? • FatiGO is used to extract relevant GO terms for a group of genes with respect to a set of reference genes (the rest) • Can be used to list proportions of GO terms in a set of genes http://fatigo.bioinfo.cnio.es
FatiGO data sources • Uses tables of correspondences between genes and their GO terms (human, mouse, Drosophila, yeast, worm and UniProt proteins –curated if possible) • Uses genes from GenBank, UniProt (Swiss-Prot/TrEMBL), Ensembl etc. • Problem in lack of standardisation of names –use EBI xrefs to link them, and for other databases they use their own gene IDs • For GO associations they include GO evidence codes, e.g. IEA
Using the GO hierarchy • Different levels in the GO hierarchy can be chosen, depending on specificity required • FatiGO suggest using level 3 –questionable? • Deeper you go (more specific) –fewer genes annotated to the terms • Once level is set, for each gene FatiGO moves up hierarchy until set level is reached –increases no. of terms mapped to this level –easier to find relevance in different distributions of GO terms • Repeated genes are counted once
How FatiGO works • Given two sets of genes, and selected GO level • Retrieves GO terms for each gene on correct level • Applies Fisher’s exact test for 2x2 contingency tables for comparing 2 sets of genes (to get p-values) • Extracts GO terms with significantly different distributions • After correcting for multiple testing, provides adjusted p-values for 3 tests: • Step-down minP method (Westfall and Young) • FDR independent (Benjamini & Hochberg) • FDR arbitrary dependent (Benjamini & Yekutieli )
Testing sets of GO terms Gene set 2 Gene set 1 Set 1 Set 2 Significantly higher distribution in 1 than 2 Transport 20% Transport 60% Observed difference and possible stronger differences Same distribution Regulation 20% Regulation 20%
Multiple testing • P-value:is the probability, under the null hypothesis of obtaining the observed result or a more extreme result than one observed • Testing multiple null hypotheses (one per GO term) that there is no difference in the frequency of terms in each set • For 1 test, type I error rate (probability of rejecting a true null hypothesis) is 0.05, but for multiple tests this increases -Family wise error rate (probability that one or more of rejected nulls are true ) • Multiple testing allows controlling of Family Wise Error Rate (FWER) and False discovery rate (FDR)
Step down min-P method • Controls FWER • Procedure with a test statistic equivalent to Fisher's exact test for 2x2 contingency tables • No. of random permutations set at 10000 • Examines how many of the permuted p-values are smaller than the one under consideration • Adjusted p-value for hypothesis H is level of entire test set procedure at which H would be rejected, given values of all test statistics involved
Controlling False Discovery Rate • Tends to be more liberal than controlling FWER • Controlling expected no. of false rejections (Type 1 errors) among rejected hypotheses • Consider the proportions of erroneous rejections to the total number of rejections. Average value of proportion = FDR • FDR can be dependent on or independent of test statistics, FatiGO gives: • adjusted p-value using the FDR method of Benjamini & Hochberg –control of FDR under independence • adjusted p-value using the FDR method of Benjamini & Yekutieli –control of FDR under arbitrary dependent structures
Using FatiGO -Input • Search for Unigene cluster ID, or specific gene IDs • Input results from SotaTree or Pomelo • Or input Excel or text file with list of gene or protein IDs, each on a new line • Input reference set of genes • Select GO ontology and level (inclusive) • Select whether multiple test should include adjusted p-values for minP test
FatiGO output • FatiGO returns four columns: the unadjusted p-value (p-value from Fisher’s exact test without adjusting for multiple comparisons) and adjusted p-values based on the three methods • Results are ordered by increasing value of the adjusted p-value, facilitating the selection of GO terms with the most significant differences. • P-value of 0.01-0.05 –some evidence, 0.01-0.001 –strong evidence and < 0.001 –very strong evidence against null
FatiGO example output Query set Reference set Unadjusted p-value FRD (indep) adjusted FDR (depend) adjusted
Other features of FatiGO • You can input a list of genes and extract the GO terms sorted by percentages • You can use GO results as a way to find differentially expressed genes –see if after correcting for multiple testing, some GO terms are overrepresented (provides more resolution where p-value has no meaning)
FatiWISE • Data mining to retrieve additional biological info on InterPro motifs, KEGG pathways and Swiss-Prot keywords • Uses Fishers exact test for 2x2 contingency tables for comparing two sets of genes and finding significantly different distributions • Corrects for multiple testing to get adjusted p-value • Can get stats for one set of genes or compare 2 sets
FatiWISE input and output • Data sources: KEGG, InterPro, UniProt • Input: • one or two sets of genes • Selection of organism (for pathway) • Output: • Unadjusted p-value • Step-down min P adjusted p-value • FDR (arbitrary dependent) adjusted p-value
Summary • Data mining is used to bring the biology into results • Curated data sources are the best for this, due to structure and controlled vocabulary • FatiGO and FatiWISE are simple web tools enabling data mining on 1 or 2 sets of genes • Exercises: http://cbio.uct.ac.za/courses/MicroDM/