Download
1 / 38
380 likes | 383 Views
OPTIONS FOR MASS RAPID TRANSIT (MRT) UNDER AN INTEGRATED URBAN TRANSPORT FRAMEWORK. National Workshop on Urban Air Quality Management and Integrated Traffic Management organized by IUCN at Avari Towers, Karachi 13-14 September, 2006. by Amer Z. Durrani (World Bank), with contributions from

E N D
OPTIONS FOR MASS RAPID TRANSIT (MRT)UNDER AN INTEGRATED URBAN TRANSPORT FRAMEWORK National Workshop on Urban Air Quality Management and Integrated Traffic Management organized by IUCN at Avari Towers, Karachi 13-14 September, 2006 by Amer Z. Durrani (World Bank), with contributions from Ayaz Parvez, Gerhard Menckhoff and Vincent Gouarne (World Bank) South Asia Sustainable Development Unit The World Bank
The Typical Urban Transport Scenario – Continuing Trends in Developing Countries • The Focus for Bank’s involvement in Urban Transport • Strategic Framework & Decision Model for MRT Interventions • Types of MRT • Comparison of MRT Options • Strategic Considerations for MRT Decisions • Bus Rapid Transit (BRT) • Operational Features of some BRTs in Different Countries • Comparison of Performance and Cost of Typical MRT Systems • An India Case Study – Urban Poverty and Transport • A Pakistan Case Study – An Urban Transport Situation Assessment for Karachi
The Typical Urban Transport Scenario –Trends in Developing Countries • Urban population expanding at more than 6 percent per year in many developing countries. • The number of mega-cities (with over 10 million inhabitants) expected to double within a generation. • More than one-half of the developing world’s population and between 1/3rd and one-half of its poor will live in cities. • Traffic Congestion and Air Pollution is on the rise in these cities. • Pedestrians and Non-Motorized Transport (NMT) are poorly served by the cities transport systems.
The Typical Urban Transport Scenario –Trends in Developing Countries • Journeys to work are becoming excessively long and costly for the extreme poor. • Municipalities are under-pricing the congested road space and right of way, and not charging appropriate impact fees for land development. • Fare and service controls are ill-directed, and are not part of comprehensive city transport financing plan, and worse still, their impacts on poor are not assessed. • Financing issues hindering provision, improvement, and maintenance of appropriate and demand driven mass transit solutions for the cities’ residents.
World Bank’s Focus in Urban Transport • Urban transport contributes to poverty reduction • indirectly through its impact on the city economy • directly through its impact on the daily needs of the poor. • View transport needs in the broader context of urban development • Need a shift of emphasis from economic and financial viability alone to a strong poverty focus. • Need to target socially excluded (in terms of inaccessibility to jobs, schools, health facilities and social activities) and not just the income poor. Therefore, the three pillars of the Bank’s Urban Transport strategy include: • improving the operational efficiency of transport; • better focusing of interventions to assist the poor; and, • policy and institutional reform.
Improving the Operational Efficiency of Transport: Remedies for The Road System • Improve transport efficiency through better system management • Technical Assistance and Investment for Adoption of Modern traffic management techniques • Better road operation and maintenance
Improving the Operational Efficiency of Transport: Remedies for Non Motorized Transport • Due Recognition in Transport Planning, including road design • Provision for the rights and responsibilities of pedestrians and bicyclists in traffic law • National Strategy on NMT • Provide Separate Infrastructure where appropriate
Improving the Operational Efficiency of Transport: Public Passenger Transport • Bus lanes and automatic priority at intersection help, but constrained by inadequate enforcement by untrained police • Exclusive bus-ways perform (have been a success in many developing countries) nearly equivalent to rail-based systems at much lower cost (except in very high traffic volume corridors)
Improvingthe Operational Efficiency of Transport: Mass Transit • Investment decisions based on comparative analysis of strategic objectives, technological alternatives, and socio-economic and financial implications—not on short-term political or commercial opportunism. • Rail-based mass transit systems have a role only in very large cities, as these are less congesting and serve the peripherally located in work journeys. • Plans for urban rail systems must be part of an overarching urban transport strategy—physical and fare integration between modes, specially to avoid the exclusion of the poor.
Improving the Operational Efficiency of Transport:Mass Transit • Mass transit projects should be cautiously appraised vis-à-vis fiscal sustainability and affordability—given the very high costs of building and operating, and since these can prove expensive for passengers (especially the poor). • Mass transit interventions appear to yield the greatest benefits when incorporated into citywide price-level, with an advance estimation of full cost of investment on municipal budgets, fares and impacts on the poor.
Improving the Operational Efficiency of Transport: Defining the Role of the private sector in improving efficiency • In cases of very high demand for faster movement, private capital finance can be secured for investments in roads and metros. Examples include Bangkok, Buenos Aires and Kuala Lumpur • Public sector must maintain a strategic, planning and regulatory role in such scenarios – need very high quality public institutions to perform this role.
Better focusing of Interventions to assist the Poor • Designing poverty-targeted transport interventions • 1st Approach – Directly serve locations where the poor live and work (such as access to slums) • 2nd Approach – Target disadvantaged groups as a social safety net • Addressing environmental pollution (poor tend to most vulnerable) and safety/security concerns
Different Transport Demands Empirical studies in individual cities show evidence of differences in the composition, number, and mode of trips between poor and non-poor (Thompson, 1993; Godard and Olvera, 2000). • The urban poor make fewer trips per capita than the non-poor, but the differences are not extreme. • The travel purposes of the poor are more limited in scope, with journeys to work, education and shopping dominating. • Transport mode differs substantially, with the urban poor relying heavily on walking, and the non-poor making many more motorized trips.
Policy and Institutional Reform • Infrastructure Pricing • Service Provision & Pricing • Urban Transport System Financing • Strengthened Institutions • Sound Political Framework
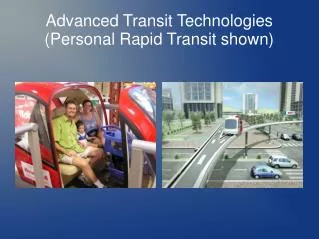
Strategic Framework & Decision Model for MRT Interventions – Types of MRT • Busways – these are generally segregated sections of roadway within major corridors, with horizontal protection from other traffic, and priority over other traffic at junctions, which are generally signalized. • Light rail transit (LRT) – this is at-grade, with similar horizontal protection to busways. • Metros – these are fully segregated, usually elevated or underground. It is the segregation that is critical to providing a rapid service, and the technology that allows a high mass ridership to be carried. • Suburban rail – these services are usually physically part of a larger rail network, usually at-grade and fully segregated incorporating road-rail segregation or controlled level-crossings.
Strategic Framework & Decision Model for MRT Interventions – Comparison of MRT Options • Use of space • Busways usually involve reallocation of existing roadspace • LRT often does the same, but may also add new capacity, e.g., when using former rail alignment. • Metros add new capacity, typically increasing the passenger-carrying capacity of a major corridor by a factor of 3 (they may have no impact on road capacity, or if elevated lead to small reduction) • Integration • All systems require interchange to provide an integrated public transport system • Rail systems, and busways operating ‘trunk-and-feeder’ services require more interchange.
Strategic Framework & Decision Model for MRT Interventions – Comparison of MRT Options • Capacity • Busways depending on specification, have a practical capacity of 10-20,000 passengers per hour per direction (pphpd), or occasionally higher. • There are no examples of LRT carrying flows in excess of 10,000 pphpd, and there is reason to doubt whether they can achieve much higher flows. • Metros by comparison carry very large passenger volumes – 60,000 pphpd or higher; and high-specification suburban rail can typically carry 30,000 pphpd.
Strategic Framework & Decision Model for MRT Interventions – Comparison of MRT Options • Level of service • Rail systems can generally provide a high quality ride, and when segregated, regularity. • Bus systems perform less well in these respects. • Ability to segment the market • Bus systems have this ability, by running basic and air conditioned/guaranteed seated/express buses. • Rail systems exceptionally provide women-only carriages, but otherwise do not segment the market.
Strategic Framework & Decision Model for MRT Interventions – Strategic Considerations for MRT Decisions
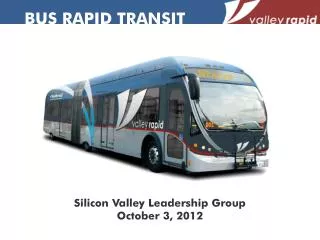
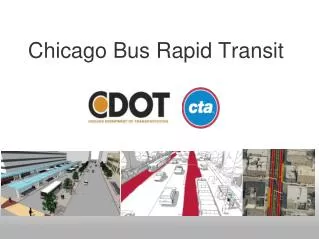
Bus Rapid Transit (BRT) – Worldwide Examples and Some Common Features • North America (Ottawa, Boston, Charlotte, Cleveland, Miami, Honolulu), Latin America (Santiago, Lima, Quito, Bogota, Buenos Aires, Curitiba Sao Paulo, Belo Horizonte, Porto Alegre, Leon de Guanajuato ), Europe (England, Germany, France, Sweden), Asia (Japan), Australia • Common Features • Physically segregated busways • Trunk-feeder operations • Fare prepayment, flat fares, free transfers with feeder buses • High station platforms • Mostly operated by private bus companies • High passenger demand • Quick implementation • Much lower cost than LRT or metro alternative • Metro-like appearance • Distinct identity and good image
What do these BRTs have in common?Quick implementation • Bogotá (TransMilenio) • From idea to commissioning of initial line (9 miles): 29 months • Total Phase 1 (additional 16 miles): +19 months • Phase 2 (additional 28 miles, 2003-2005): +36 months TOTAL-- 7 trunk lines totaling 53 miles: 84 months (Metro Option: 1 line totaling 18 miles was planned to take >100 months) **************************** • Washington, DC (Metrorail) 5 metro lines totaling 103 miles >360 months (>30 years)
What do these BRTs have in common? Much lower cost than rail alternative • Bogotá • TransMilenio infrastructure investment (Phase 1) $240 million TransMilenio private investment $100+ million Total public investment $3.6 million/mile$0.34/pass. (3 years) • Rail Metro– was ready for bidding in 1998 (18 miles, $3.04 billion, 1.1million pass/day estimated for 2008) $167 million/mile$2.45/pass. (3 years) • Quito(Trole Phase 1 – 7 miles) • Total investment $57.6 million, i.e. $3.2 million/mile of which 80% for trolley buses and electrical equipment. • Non-electrical investment ($11.3 million)$0.6 million/mile
Bogota “Transmilenio” • 53km segregated busways • Integrated trunk- feeder scheme • 117 stations, 7 transfer terminals • 800,000 ppd, max load point 35,000 pphd • Commercial speed 20-30kph • Public investment $2.25m/km, • funded by a local gasoline surtax
What do these BRTs have in common?Metro-like appearance Curitiba • Bogotá
Bus Rapid Transit (BRT) – Also, soon to be implemented in… • Guayaquil (Ecuador) • Lima (Peru) • Barranquilla, Bucaramanga, Cali, Cartagena, Medellin, Pereira (Colombia) • San Jose (Costa Rica) • San Salvador (El Salvador) • Dehli (India, 132 km of center-lane busways on 7 major corridors)
Mumbai Case Study: Main Mode to Work • Rail remains the choice (22 percent of total) for long distance commutes—and even higher (25 percent) for middle income households • Commuters in the In Rs 7,500-20,000 income range (the middle income households) who are the largest users of public transit . • In the highest income category (In Rs 20,000 or more), the share of walking declines to 15% and is replaced 21% for two-wheeler and 25% for car.
Mumbai Case Study: Expenditure on Transportation Mean Per Capita Expenditure (InRs/Month) on Transportation and Share in Income (%) The poor travel less but still spend more of their meager incomes on travel
Mumbai Case Study: Conclusions • The majority of urban households (44% of commuters)—but especially poor households (63 percent)—rely on walking. Implies that majority of households will not benefit directly from improvements in public transit, but will benefit from the construction of footpaths and roads. • Public transit remains an important factor in the mobility of the poor, and especially in the mobility of the middle class. • Overall, rail remains the main mode to work for 23% of commuters, while bus remains the main mode for 16% of commuter.
Mumbai Case Study: Conclusions • The modal shares for bus are highest for the poor in zones 1-3 while rail shares are highest for the poor in the suburbs. • Poor are forced to choose lower paid work closer to their homes (and thus would appear to have fewer job opportunities resulting in greater unemployment) due to the high share of transport expenditures as percent of their incomes—thus impeding poverty alleviation.
Karachi: Urban Transport Challenges • Fast urbanization – Karachi is growing 3.5% annually, person-trips per day are increasing 9% annually, and population is increasingly living farther away from the city center. • Rapid motorization – 6% per annum; share of cars/motor cycles has increased from 37% to 45% in the last decade. • Increasing traffic congestion – motorization, encroachments, uncontrolled parking, poor traffic enforcement, inadequate investments in transport system improvement—travel times increasing making Karachi un-competitive. • Declining share of trips by public transport (53% to 44%) - mostly due to poor quality & quantity of public transport services, poor incentives, weak legislation & regulatory framework. • Declining road safety and air-quality, and growing noise pollution - additional health burden.
CITY FINANCE SERVICES (W&S, SWM, Transport) Urban governance LAND Framework Growth and Poverty Reduction
Karachi: The Way Forward First Steps • Formulate An Urban Transport Policy & Strategy with participation & role of consumers/voice of poor and women • Develop prioritized multi-year investment plans
Karachi: The Way Forward In the short-term: Focus on intensive management of existing urban road space • Traffic engineering & management (re-circulation, off-street parking, traffic signaling). • Selective capacity & safety improvements (key junctions, walkways). • Introduce measures to manage growing demand (charged parking, higher road use charges). • Facilitate private sector investments, rationalize fare policies, introduce route/area franchising, provide terminal facilities. • Update legislation & regulatory framework (motor vehicle ordinance, bye-laws). • Proper enforcement —public awareness & citizen’s support. • Introduce systematic air quality monitoring, enforce vehicle emission standards, phase-out gross polluting vehicles.
Karachi: The Way Forward In the medium-term • Develop a mass transit system –BRT with 20,000 passengers/hour at 1/10th the cost of rail-based system In the long-term • Convert high demand BRT corridor(s) into rapid rail system • Integrate public bus and rail systems
Karachi: The Way Forward • Challenge: urbanization + motorization • Pressure on scarce street space; rapidly deteriorating service levels -- especially for buses and non-motorized modes • Modal shift to car, further increasing congestion levels Physical capacity addition alone cannot win this game • Traffic management • Mode segregation • Supportive regulation of public transport transport • Demand, parking management (and pricing) • Pavement management • Key success factors: appropriate revenue sources, information management, enforcement
Thank you for listening and just remember, its her future that we hold in our hands……..