Download
1 / 26
260 likes | 268 Views
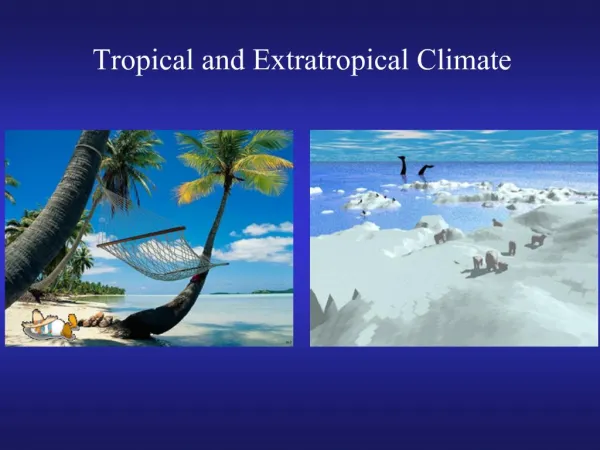
Extratropical Climate and Variability in CCSM3. Michael Alexander & James Scott NOAA-CIRES Climate Diagnostics Center Clara Deser NCAR. Overview: A Broad Survey. Long term means and variance SST, Net Surface Heat Flux, Mixed Layer Depth Upper Ocean Processes

E N D
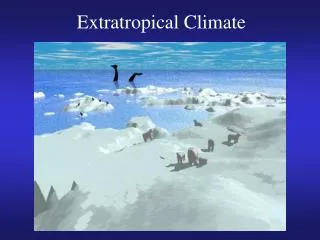
Extratropical Climate andVariability in CCSM3 Michael Alexander & James Scott NOAA-CIRES Climate Diagnostics Center Clara Deser NCAR
Overview: A Broad Survey • Long term means and variance • SST, Net Surface Heat Flux, Mixed Layer Depth • Upper Ocean Processes • Winter-to-winter SST anomaly recurrence: the “re-emergence mechanism” • Winter Atmospheric Circulation • Mean & Variance SLP and Z500 • Patterns: NAO/AO, PNA, PDO
Years 1-799 Annual Mean SST (ºC)
Annual Mean Net Surface Heat Flux (W m-2) >0 into ocean Generally anti-correlated with SST biases
Too large Too small Monthly Surface Temperature Standard Deviation (C) CCSM
Generally deeper than “observed” March Mixed Layer Depth (m) CCSM3 Levitus
Annual Cycle of Temperature (ºC) & MLDKuroshio Extension Region: 25ºN-45ºN,165ºE-175ºW CCSM Levitus May May X March March
2 summer MLD Re-emergence in the Kuroshio Extension RegionLead-lag Correlations between T´(month,depth) and T´ in summer at depth 0 m 60 m 120 m 180 m 1 3 0.3 0.6 0.6 T’ Depth (m) Mar Sep Mar
Generalized Re-emergence: Local Lead-lag Correlations of SST with T’ in summer at depth along 42º-52ºN Feb+1 Sep+0 Apr+0 SST Lags Time SST Leads
Northern Hemisphere Wintertime Atmospheric Variability • Mean & Standard Deviation SLP & Z500 • Years 1-799 • Variability Patterns (EOFs) (from Mark Steven’s Web page) http://www.cgd.ucar.edu/cms/stevens/ccsm3/ccsm3.T42.html • Years 750-850
Mean SLP (mb) DJF Too strong Zonal circ.
NCEP CCSM3 49.4% 46.8% North Atlantic Oscillation (NAO) EOF 1 500 mb Height (m) DJFM
NCEP 38.4% Pacific Variability (PNA)EOF 1 500 mb Height (m) DJFM CCSM 40.1%
Arctic Oscillation: SLP EOF 1 NCEP CCSM3 31.5% 33.7%
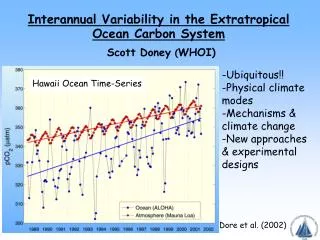
Pacific Decadal Oscillation1st EOF of Monthly North Pacific SSTA 24.5%
“Pacific Decadal Oscillation” T42 Control Run years 100-500 r (1 yr) = 0.3
Summary • Many processes are simulated reasonably well: • e.g. North Pacific SST “Re-emergence” • NAO • Other processes differ somewhat from the real world • e.g. PNA (AO?) • Hope these preliminary findings will motivate you to have a closer look.
Correlation of PDO Index with TS and SLP TS SLP CCSM3 NCEP
Annual Cycle of Monthly Mean & Standard Deviation of SST (°C) along 42ºN CCSM3 NCEP
Temperature Variance (°C2) of Annual Means at 200 m CCSM3 White Levitus