Download
1 / 48
480 likes | 482 Views
This study examines the structure of clouds, precipitation, and winds in midlatitude cyclones using a multisensor database. The aim is to evaluate the performance of climate models and understand the implications of cyclones for climate change.

E N D
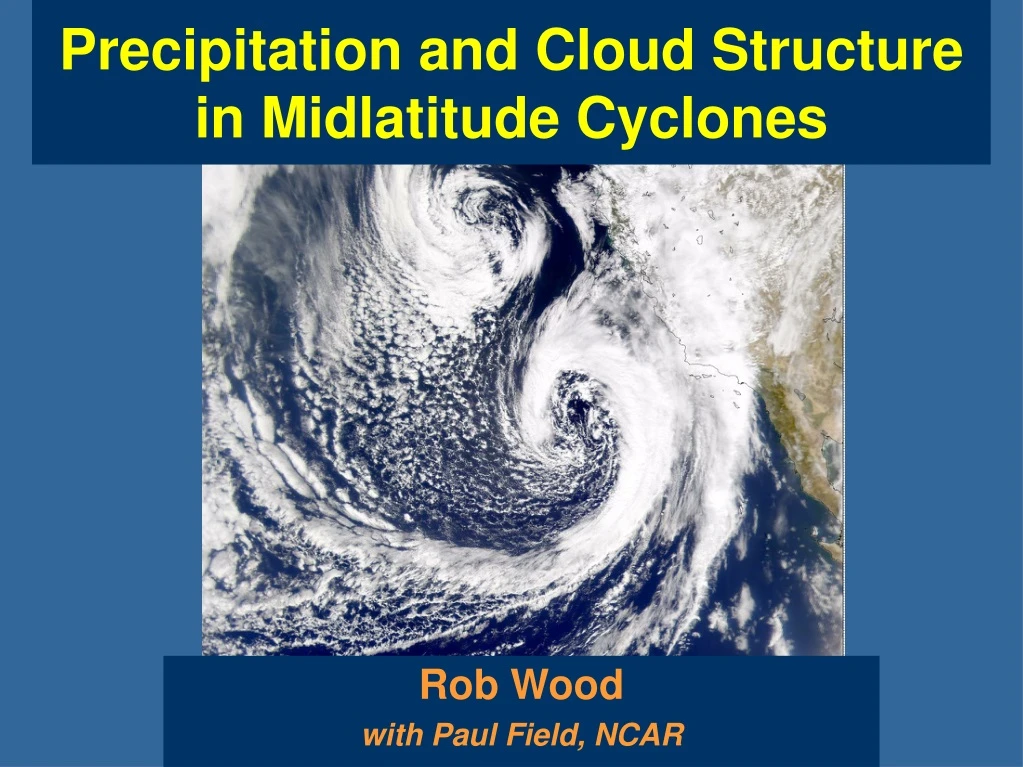
Precipitation and Cloud Structure in Midlatitude Cyclones Rob Wood with Paul Field, NCAR
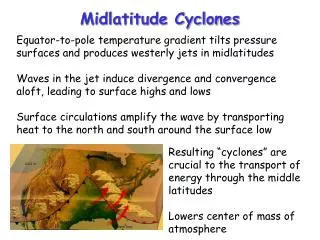
stable unstable Why cyclones? Solberg (1928) examined all types of waves in the atmosphere using a two-level baroclinic model: Short waves stabilized by gravity Long waves stabilized inertially (earth’s rotation) lengthscale from Bjerknes and Holmboe, J. Met. (1944)
When, where? Zonal wind pressure [hPa] • Zonal winds peak in hemisphere with strongest T/y large growth rates for baroclinic disturbances DJF Temperature 90S 60S 30S EQ 30N 60N 90N Holton, 1992
Hemispherical view 500 hPa geopotential height wavenumber 7 4000 km N May 17 2007
The structure of a midlatitude cyclone From Schultz et al. (1998) C O L D W A R M
Idealized cyclone Carlson 1998 L
Multisensor cyclone database • Synthesize data from useful satellite datasets and reanalysis to examine mid-latitude cyclone structure • Cyclone-relative coordinate system to facilitate comparisons and composite analysis • Make available to community • www.atmos.washington.edu/~robwood/data/cyclones.html
Cloud Compositing H L Lau and Crane 1995
Satellite data • MODIS: Cloud top temperature and optical thickness (11o daily data) • AMSR: Rain rate; column WVP; SST • Quikscat: Surface wind speed and direction • All available data from 2003-2004 • ~2000 cyclones in total for NP, NA, SP, SA over oceanic regions • NCEP: reanalysis MSLP, T profiles (WVPsat)
Regions examined Major midlatitude storm track regions of the northern and southern hemispheres
Cyclone strength and size: Season Seasons reversed for SH storms Mak 1982
Quikscat winds (all NA storms) [m s-1]
AMSR water vapor path (all NA storms) [mm] Warm sector km
Warm Conveyor Belt thermodynamic dynamic R = WVPV W V S q0 = WVP / S
Generate new composites (combine NA, NP, SA, SP) Strength Moisture V r<2000 km WVP r<2000 km Quikscat windspeed WVP
Warm conveyor model R = WVP V • Simple model quantifies cyclone-wide precip. as a function of its strength and WVP • WVP controlled by SST Clausius -Clapeyron
Column mean relative humidity RHcol = WVP/ WVPsat invariant to changes in storm strength or vapor
Cloud Top Temperature All N Atl. cyclones
Cloud Top Temperature Normalised pdfs of composited cyclones Rainrate km km All N Atl. cyclones km Bjerknes and Solberg
Implications: precipitation and storm density under a warmed climate • dRext + dRT = LdP • LdP = k dT - 2.5 • k 3 W m-2 K-1 (quite robust across models) number and/or strength of storms must decrease Allen and Ingram, Nature, 2002 also Mitchell et al. 1987
Implications: cloud feedback • Fewer and/or weaker storms under warmed climate less high cloud more OLR negative feedback • But, assumes constant albedo (“midlatitude blanket” argument) • Future work: Test using radiative transfer calculations/CERES
Conclusions • Multisensor database of midlatitude cyclones • Preliminary exploration of the structure of clouds, precip, and winds in midlatitude systems • Expand to longer timescales/space scales to improve statistics • Use to evaluate the performance of climate models
Cyclones and climate change • Carnell and Senior (change in distribution of storm strength) • Poleward movement of the storm tracks (Fyfe, Yin, Bengtsson, Fu et al., Lorenz, Salathe…) • More precipitation/less precipitation?
6 4 2 0 -2 -4 -6 -8 change in number of storms 1025 1015 1005 995 985 975 965 955 945 storm central pressure [hPa] Fewer weak storms, more strong ones? Carnell and Senior, Clim. Dyn., 1998
18 15 12 9 6 3 0 Storm tracks Number of storms per month per 5x5o area Bengtsson et al. (2006)
Poleward storm track movement? Change in number of storms per month per 5x5o area (C 21st- C 20th) DJF JJA Also, Fu et al. (MSU), Yin, Fyfe…. 3 2 1 0 -1 -2 -3 Bengtsson et al. (2006) Mean values 5-15
cloudparameterizations Uncertainty about behavior of clouds is the leading cause of spread of temperatures under 2CO2 conditions Murphy et al. 2004 Nature Stainforth et al. 2005 Nature
Levels of understanding • Bjerknes – high clouds and precipitation associated with ascending regions of the cyclone • QG theory – spatiotemporal variations and strength of ascending regions understood as first order response to…. • Marriage of QG theory and moisture (latent heating) incomplete • Limitations upon what quantitative questions can be answered from a theoretical perspective (e.g. climatological response of cyclones to changing baroclinicity
But no consensus….. ECHAM-5 Bengtsson et al., J. Clim., 2006 Trends in cyclone strength dependent upon diagnostic used to define storm strength (pressure depth vs vorticity) Number per month No increase in strong storms 0 5 10 15 20 Storm intensity [10-5 s-1]
Compositing cyclone center
Cyclones in the community atmosphere model (CAM) • Community Atmosphere Model (CAM 3.0) run for 5 years with different model configurations/parameterizations • Identical cyclone location methodology • Different model configurations: control : standard version but at 1x1o resolution micro : with new microphysics scheme (Morrison) ssat : increase critical RH for ice (from 90% to 100%) nodeep : deep convection scheme turned off noconv : deep and shallow convection schemes turned off 4x5 : lower resolution (4x5o) Thanks to Rich Neal, Andrew Gettelman, Phil Rasch
Cyclone mean rain rate in CAM • Models show similar increases in R with WVP consistent with obs. • Model R is more strength-dependent than obs. models obs
Clausius-Clapeyron constraints • Clausius-Clapeyron constrains water vapor changes with SST in model and obs. cyclones Lapse rate changes needed to explain WVP changes z T
Clausius-Clapeyron constraints • Clausius-Clapeyron constrains precipitation changes in model and obs. cyclones Large-scale precipitation changes governed by changes in cyclone strength and frequency
High clouds • Very sensitive to model configuration • Models show stronger moisture dependence than observations