Download
1 / 19
190 likes | 364 Views
Congressional Elections. ‘On year’ and “Off-years” Midterms House races highly predictable (usually) incumbents often win at 97% rate varies with economic conditions. Midterm US House Elections, 2010. Any predictions? Now: Dem 257, GOP 178 (+ 79 D) Dems picked up 21 seats in 2008

E N D
Congressional Elections • ‘On year’ and “Off-years” • Midterms • House races highly predictable (usually) • incumbents often win at 97% rate • varies with economic conditions
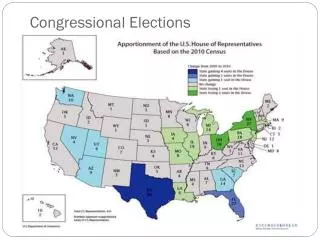
Midterm US House Elections, 2010 • Any predictions? • Now: Dem 257, GOP 178 (+ 79 D) • Dems picked up 21 seats in 2008 • 40 seat loss in 2010 = GOP majority • What happened in 2006? • What will happen in 2010?
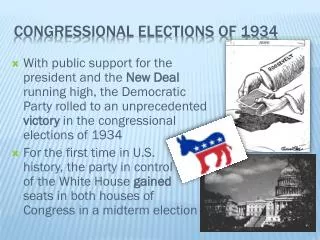
Patterns in Midterm Elections • Regular pattern of incumbent party seat loss • 2006, GOP lost 29 seats • 1994, Dems Lost 54 seats of 435 (biggest loss since 1946) • Nearly every midterm since civil war, party of President loses seats in US House • 1946-2000 average seat LOSS = 25.5 • 1946-2000 1st term avg LOSS = 13.3 (2002 = +8) • 2nd term avg. LOSS = 37.7 (2006 = 30)
Patterns in Midterm Elections • Why • huge swings not unheard of • 40 or more seats lost in…1938, 1958, 1966, 1974, 1994 • Democrats gained 28 seats in 2006 • could have been more, given vote swing against GOP
Midterm Elections • Look at “on-year” election prior to big losses • 1932 FDR, 101 seat gain; 1936 • 1956 IKE, 2 seats gain • 1964 LBJ landslide, 36 seats gain • 1972 Nixon landslide, 12 seat gain • 1992 Clinton 43%, 9 seat loss
Patterns in Midterm Elections • Why midterm loss? • Surge and Decline (mobilization of President’s supporters in “On years”) • 1932, 1936 (1938), 79 seat loss • 1964 (1966); 48 seat loss • Turnout difference = different pool of voters in midterm • President’s popularity tends to decline latter in term, and in 2nd term
Patterns in Midterm Elections • Why midterm loss? • Economic crisis • 1938; 79 seat loss • 1958; 49 seat loss for IKE / GOP • Double, triple whammy • After landslide, during economic crisis, in 2nd term • 1938
Patterns in Midterm elections • Why midterm loss • Other events • 1966: Vietnam, urban riots • 1994: • Tipping point in gradual realignment toward GOP • term limit movement, • Perot activists move to GOP
Patterns in Midterm Elections • How should we interpret national election: • Policy mandate, or "referendum" on government of the day • "Normal" pattern reflecting trends in aggregate support for the two parties, and "built in" effects of districting? • Voter concern about “local” issues and individual candidates?
Patterns in Midterm Elections • Fit this into Partisan model of voting • Factors affecting vote choice • party affiliation • incumbency • economic conditions • issues of the day • the candidate & campaign
Patterns in Midterm Elections • Fit pattern into system where incumbents are usually very safe • safe one party districts • each district loaded with voters from 1 party • incumbent visibility • name recognition • incumbent PAC $$ • constituent service
Midterm elections • If incumbents so safe, and party voting so predictable • How can so many seats swing? • Retirements
Patterns in Midterm Elections • Don’t expect more than 20-30 seat swing in 2010 from Dems to GOP • “price” of seats now higher • 5.0% swing in 1958 = 47 seat loss (R) • 5.8% swing in 1974 = 48 seat loss (R) • 6.3% swing in 1996 = 55 seat loss (D) • 5.5% swing in 2006 = 29 seat loss (R)
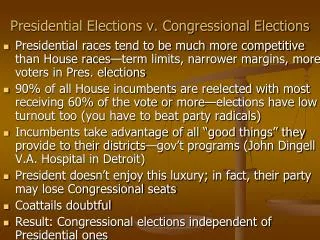
Problems w/ Congressional Elections • Apart from rare midterm upheaval, little competition • 97% of incumbents re-elected • some years, 20-25% of seats w/ only one major party candidate • huge fundraising advantages for incumbents (5x and growing)
Popular approval of Congress • Annual average approval • Low points: • 1992 • 2008
Popular approval of Congress • Today (2010) overall approval stands at historic low • 15% approve how Congress is doing its job • lower than 1992
Causes of low approval? • Low regardless of which party is in power • Reason A • Reason B • Reason C
Consequences of low approval • Incumbents retire • “quality” challengers emerge • incumbent party loses seats • Popular support for “reforms” • Campaign finance • PR elections • Term limits
Does how we elect Congress matter? • Would reforms change how Congress functions? • Would they change how people evaluate Congress?