Download

1 / 45
450 likes | 560 Views
Part 1: Recruitment and funding. Congressional Elections. An Upcoming Example: 2010. CQ Election Watch. Who becomes a candidate?. Role of Ambition Career Concerns Recruitment & Assistance: National Networks of parties & interest groups “Recruiting” begins 1.5-2 yrs before election

E N D
Part 1: Recruitment and funding Congressional Elections
An Upcoming Example: 2010 • CQ Election Watch
Who becomes a candidate? • Role of Ambition • Career Concerns • Recruitment & Assistance: National Networks of parties & interest groups • “Recruiting” begins 1.5-2 yrs before election • To both recruit new talent and keep incumbents from retiring • Role of open seats • Role of external events, election type, and Presidential popularity
The Incumbency Advantage • Since WWII, 93% incumbents reelected in House, 80% in Senate • Relatively recent phenomenon. Why? • Recruitment of better candidates • Franking privilege • Access to media • Redistricting • Job more appealing now than before • Ability to “claim credit” for particularized benefits • “Pork Barrel” projects • Position-taking • Bill introduction • Roll call voting • Hearings & Investigations
FIGURE 3.1. House and Senate Reelection Rates, 1948-2006Sources : Ornstein et al. Vital Statistics on Congress, 2001-2002; Abramson, Aldrich, and Rohde, Change and Continuity in the 2000 and 2002 Elections. Note, the percentage includes only those seeking reelection
FIGURE 3.2. Percentage of House Incumbents Winning with At Least 60 Percent of the Major Party Vote, 1956-2006 Source: Collected by Authors
Candidate Selection / Nomination Processes • Candidates for general election usually selected through partisan primaries • Several Types of Primaries • Closed: only voters registered with a party can vote in its primary • Open: voters can vote in either party’s primary (but only one) • Blanket: voters can vote in primary for one candidate for each office, regardless of party
Blanket Primaries InvalidatedCalifornia Democratic Party et. al. v. Jones (2000) • Democrat, Republican, Libertarian and Peace & Freedom parties challenged blanket primary in court as violating 1st Amendment right to free association • “In no area is the political association’s right to exclude more important than in the process of selecting its candidates” -Scalia • Louisiana employs nonpartisan primary, with runoff system
Money • Average Senate race $3.6m, House race $667,000 • In close House races, winners spent $1.5m on average • This is not counting independent efforts of interest groups • More expensive now because less party involvement • Direct primaries whereas before candidates chosen by party leaders in a caucus • Volunteers used to mobilize voters, now TV ads, mail, etc.
FIGURE 3.3. Spending in Congressional House Elections, 1974-2006.
FIGURE 3.3. Spending in Congressional Senate Elections, 1974-2006.
Campaign Finance • Federal Election Campaign Amendments of 1974 • Limits on individual & group contributions, reporting requirements • Buckley v. Valeo (1976): Congress may not limit expenditures • Spending equated with speech • Hard Money • Limits on Individuals and PACs giving to candidates and parties • Soft Money (for “party building” purposes, not supporting a specific candidate) • New carpeting, office furniture • Advertising urging voters to vote for that party • Party committees can’t accept or spend soft money
Political Action Committees (PACS) • A PAC is an account that gives interest groups a way to pool the resources of their members to support candidates for federal office, as opposed to supporting those candidates directly. PAC funds separate from group’s funds. • Corporations/contractors/labor unions cannot contribute directly to candidates • Can spend unlimited amounts independently, without candidates’ cooperation or consent • PAC can give $5000 to a candidate, $15,000 to party • Political action committees were authorized by federal law in the 1970’s • Virtually all trade, professional and labor organizations have now created political action committees.
Bipartisan Campaign Reform Act of 2002 • Upheld in McConnell v. FEC (5-4, 2003) • State and local party organizations can’t spend soft money on federal campaigns. May spend it on voter registration/mobilization • Independent & coordinated expenditures: FEC must issue new rules to regulate spending by outside groups (rules not requiring formal evidence of coordination w. candidate) • Tax-Exempt groups: Nat’l parties can’t solicit $ from or contribute to any nonprofit that spends money on federal elections • Electioneering communications: Ads now covered under campaign finance limits and disclosure requirements if aired 60 days before general election or 30 days before primary election. • Affected by Citizens United v. FEC (5-4, 2010) • The Data: Opensecrets.org
Turnout • Turnout low in US, compared to other nations • 50% Presidential elections, 30-40% Midterm • Why? • Demographics; increases in Latinos, young people • Citizens must initiate registration process • More elections per year than other nations • Disaffected voters? • Exaggerated levels: • Voluntary registration in US is relatively unique • Perhaps real turnout closer to 60% in Presidential elections
The Midterm Effect • Turnout 10-20% lower in midterm elections • President’s party has lost seats in 30 of last 34 • Regularity dates back to Civil War • Possible causes? • Presidential “Coattails” and Midterm “Decline?” • Fewer moderate voters vote in midterm elections? • Midterm a referendum on President’s performance? • People predisposed against President more likely to vote? • Partisan macroeconomics? • Regression to the mean?
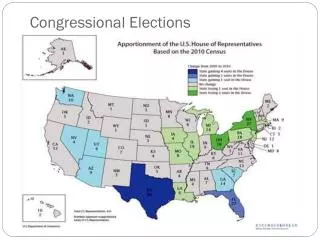
Redistricting • Required in House races since 1820s • Done by states (44 states by legislatures, 6 by commissions) • Gerrymandering: redistricting so as to maximize the number of legislative seats won by a party or group. • Governor Elbridge Gerry of Massachusetts created a salamander-shaped district to help Democrats in 1811.
Gerrymandering • Techniques • Packing • Cracking • Motivations • Partisan • Incumbency Protection • Racial
Districting Principles(In descending order of importance) • Equal population • Contiguity • Compactness • Existing political communities • Fairness
Equal population • Implied by having districts • Bad: Many states before 1960s • Illinois in 1940s (112k-914k) • Georgia in 1960s (272k-824k) • Good: Absolute equality • Is this really good? • Equal citizens is not the same as equal voters
Equal Population is Most Important: • Equal population • Colgrave v. Green (1946): “political question” • Baker v. Carr (1962): Tennessee state districts • Gray v. Sanders (1963): Ga. unit rule • Wesberry v. Sanders (1964): “one person, one vote” doctrine • Veith v. Pennsylvania (2002): no deviation allowed
Equality in 2000 Source: National Conf. of State Leg.
Contiguity • General idea: keep the district together Bad Good
Compactness • General idea: min(border/area) Good Bad
Respect for existing political communities • Iowa & Counties • Politicians like it • May be better for citizens • Getting more difficult with computer drafting of districts and (nearly) equal populations
Partisan FairnessThe Seats/Votes Relationship • Results should be symmetric • The “price” of a seat (in terms of votes) should not depend on which party gets more votes • Results should be unbiased • tied votes should give both parties equal numbers of seats Seats Seats The Ideal World Bias is the 60% 60% Asymmetry is the “kink” 50% Votes Votes 50% 50%
Responsiveness • More responsive: seats are “cheaper” for the winning party • “Swing Ratio:” The slope of the seats votes relationship More Responsive Less Responsive Seats Seats 50% 50% Votes Votes 50% 50%
Empirical swing ratio(with data from 2000) With 2000: Swing ratio = 1.9:1
Racial fairness • From 15th amendment • “The right of citizens of the United States to vote shall note be denied or abridged by the United States or by any State on account of race, color, or previous condition of servitude.” • Voting Rights Act of 1965 • Prevented dilution • 1980: Mobile v. Bolden • S.C. says you have to show intent • 1982: VRA extension allows effect • 1990: Justice dept. moved to requiring maximizing minority representation through pre-clearance
Voting Rights Act enacted in 1965 • Prohibited any voting qualifications or prerequisites • Suspended any test or other device as a prerequisite • Required 16 states to submit all changes in electoral laws to the Department of Justice • Authorized appointment of federal registrars if local registrars continued to discriminate • Amendments to the VRA in 1982 explicitly encouraged states to create “majority-minority” districts (to pack districts in order to elect minorities)
Packing -> Democratic loss of South in 1990's. • “Paradox of Representation” • More minority lawmakers and more conservative House. • Shaw v Reno (1993) • After 1990 census, NC created two majority-minority districts that were approved by the DOJ. • Some white voters sued. • Court ruled non-minority citizens could sue over racial gerrymandering if district lines were so “bizarre”.
Miller v. Johnson (1995) • Race can't be “predominant factor” in drawing a district. • Hunt v. Cromartie (1999) • Political gerrymandering is OK • Even if most Democrats happen to be black. • Majority-minority district is not evidence enough to prove race was main motivation. • Vieth v. Jubelirer • (2004, PA political redistricting) • LULAC v. Perry • (2006, Texas redistricting) • Crawford v. Marion County Election Board • (2008, Indiana voter ID)
Apportionment methods • 1790 to 1830--The "Jefferson method" of greatest divisors • Fixed “ratio of representation” with rejected fractional remainders • Size of House can vary • 1840--The "Webster method" of major fractions • Fixed “ratio of representation” with retained major fractional remainders • Size of House can vary • 1850-1900--The "Vinton" or "Hamilton" method • Predetermined # of reps • Seats for state = Population of State/(Population of US/N of Seats) • Remaining seats assigned one at a time according to “largest remainder” • “Alabama paradox” • 1940-2000--The method of equal proportions
Method of equal proportions • “Results in a listing of the states according to a priority value--calculated by dividing the population of each state by the geometric mean of its current and next seats—that assigns seats 51 through 435.” • Geometric Mean of Two Numbers: Square Root of Their Product • Examples • Geometric Mean of 1 & 2: 1.4142… • Geometric Mean of 7 & 8: 7.483… • Priority Value of 8th Seat for a State ≈ Population / 7.483 • Each of the 50 states is given one seat out of the current total of 435. The next, or 51st seat, goes to the state with the highest priority value • After being awarded a seat, a state’s priority value goes down (why?) Source: http://www.census.gov/population/www/censusdata/apportionment.html
States’ Priority values after 2000 Seat # State State seat Priority # 51 CA 2 23992697 52 TX 2 14781356 53 CA 3 13852190 54 NY 2 13438545 55 FL 2 11334137 ... ... ... ... 431 IA 5 655598 432 FL 25 654377 433 OH 18 650239 434 CA 53 646330 435 NC 13 645931 436 UT 4 645684 437 NY 30 644329 438 TX 33 643276 439 MI 16 642646 440 IN 10 642025
Reapportionment Court Challenges • Department of Commerce v. United States House of Representatives, 525 U.S. 316 (1999) • The Census Bureau can’t sample • Utah v. Evans (2002) • UT wanted NC’s final seat • Imputation challenged • Mormon missionaries miscounted • The DC compromise proposal