Download
1 / 33
340 likes | 954 Views
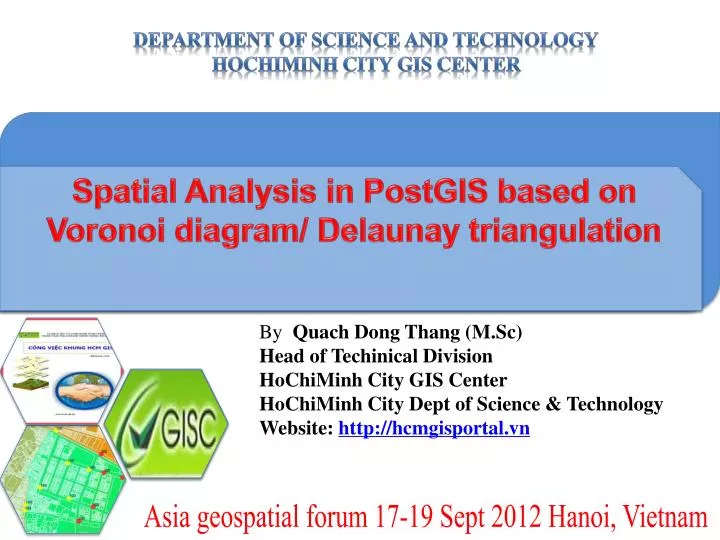
DEPARTMENT OF SCIENCE AND TECHNOLOGY hOcHIMINH CITY GIS CENTER. Spatial Analysis in PostGIS based on Voronoi diagram/ Delaunay triangulation. By Quach Dong Thang (M.Sc) Head of Techinical Division HoChiMinh City GIS Center HoChiMinh City Dept of Science & Technology

E N D
DEPARTMENT OF SCIENCE AND TECHNOLOGY hOcHIMINH CITY GIS CENTER Spatial Analysis in PostGIS based on Voronoi diagram/ Delaunay triangulation By Quach Dong Thang (M.Sc) Head of Techinical Division HoChiMinh City GIS Center HoChiMinh City Dept of Science & Technology Website: http://hcmgisportal.vn Asia geospatial forum 17-19 Sept 2012 Hanoi, Vietnam
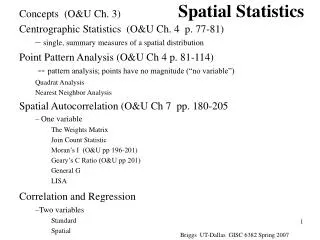
Outline • Introduction • Construct Voronoi Diagram/ Delaunay Triangulation (VD/DT) in PostGIS • Spatial analysis in PostGIS based on VD/DT • Conclusion Outline 2
The Voronoi diagram/ Delaunay triangulation is a basic problem in Computational Geometry • Voronoi diagram definiton: • Let P = {p1,p2,p3,…,pn} be a set of n distinct points in Euclidean space. • d(pi,pj): Euclidean distance between pi and pj. • Voronoi cell of pi – denoted V(pi) is defined: V(pi) = { q : d(pi, q) < d(pj, q) ∀ j ≠ i } • Voronoi diagram of a set of points P, denoted V(P) is the union of all Voronoi cells of P. Introduction 3
In other words: • Voronoi diagram is a subdivision of P into n regions. • Each region contains exactly one point of P so that if a point q is within the region of pi, then the distance between q and pi is the smallest compared to other points of P. Introduction 4
Introduction Given a set of Points 5
Introduction Voronoi Diagram 6
Delaunay triangulation for a set of points P is a triangulation with vertices are the points of P so that the circumcircle of each triangle does not contain any point of P. Introduction 7
Delaunay triangulation is the dual graph of Voronoi diagram. • Delaunay triangulation is used for creating TIN model in 3D GIS and 3D graphics. Introduction 8
Introduction Delaunay Triangulation 9
Most current GIS softwares support end-user tools to create VD/ DT Introduction 10
Introduction Create Delaunay triangulation in gvSIG using SEXTANTE plug-in 11
Introduction Create VD/ DT in Quantum GIS using Geometry Tools 12
However, for GIS programmers, solve these functions at DBMS level (right in the database) is essential to easily control and to share them across applications. Introduction 13
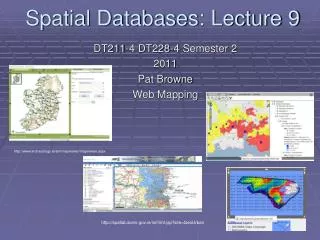
Construct Voronoi diagram/ Delaunay Triangulation directly in PostGIS Introduction 14
PostGISver 2.0 currently does not support built-in functions to create VD/ DT. • How to use third-party functions via Procedural language such as PL/ Java and PL/ R to construct VD/ DT for point features in PostGIS. • How to exploit VD/ DT to solve Voronoi-related spatial analysis problems, as well as evaluating the ability to develop, expand functions in PostGIS for GIS developers. Introduction 15
R is a free software environment for statistical computing and graphics. • PL/R is a stored procedural language supported by PostgreSQL that allows user to write PostgreSQL stored functions using the R statistical language. • Deldir package is created by Rolf Turner to compute the VD/ DT for a set of points in R environment. Construct VD/DT in PostGIS 16
Solution: use PL/ R function call out the deldir package of R to construct Voronoi diagram for point features in PostgreSQL/ PostGIS database. • In detail: • Create voronoi function in PostGIS database. • Use the voronoi function: create table voronoidiagram (gid serial primary key); SELECT AddGeometryColumn ('public','voronoidiagram','the_geom',4326,'POLYGON',2); insert into voronoidiagram (gid, the_geom) SELECT v.id, v.polygon FROM voronoi('(SELECT gid, the_geom FROM nodes ) as vor', 'vor.the_geom', 'vor.gid') As v Construct VD/DT in PostGIS 17
Construct VD/DT in PostGIS PL/R Construct Voronoi Diagram/ Delaunay triangulation in PostGIS using PL/R function Construct Voronoi diagram/ Delaunay triangulation in R using deldir package 18
Construct VD/DT in PostGIS • Jaspa (Java Spatial) is an extension for spatial data management in PostgreSQL and H2. • Just like PostGIS, Jaspa creates a template contains functions to support spatial data management (compliant OGC Simple Feature for SQL Specifications). • Jaspa manages spatial data in schema “Jaspa”, which contains ST_DelaunayTriangles() function to construct Delaunay triangulation for point features. 19
Suppose we have a PostGIS database called “voronoi” contains table “nodes” needed to build Delaunay triangulation. • Solution: Install Jaspa into existing “voronoi” database and use ST_DelaunayTriangles() function of Jaspa to construct Delaunay triangulation for table “nodes”. -- Create table delaunay to hold the Delaunay Trianagulation create table delaunay (gid serial primary key); SELECT AddGeometryColumn ('public','delaunay','the_geom',4326,'POLYGON',2); -- Create delaunay triangulation using jaspa.ST_DelaunayTriangles function. insert into delaunay (the_geom) SELECT ST_GeomFromEWKB(ST_AsEWKB(jaspa.ST_Dump(jaspa.ST_DelaunayTriangles(jaspa.ST_GeomFromEWKB(ST_AsEWKB(ST_Collect(the_geom))))))) from nodes Construct VD/DT in PostGIS 20
Construct VD/DT in PostGIS ST_DelaunayTriangles() Construct Delaunay triangulation in PostGIS using Jaspa’s ST_DelaunayTriangles() function 21
Construct VD/DT in PostGIS Display VD/ DT table in PostGIS using gvSIG open source software 22
Query point Nearest point • Spaital analysis in PostGIS based on VD/DT • Nearest point: Find the Voronoi cell V(pi) contains point q, and pi is exactly the closest point to q. Spaital analysis in PostGIS based on VD/DT 23
Spaital analysis in PostGIS based on VD/DT • Nearest pair of points • Naïve SQL: SELECT n1.gid, (select gid from nodes n2 where n1.gid <> n2.gid order by ST_Distance(n1.the_geom, n2.the_geom) limit 1 ), (select ST_Distance(n1.the_geom, n2.the_geom) from nodes n2 where n1.gid <> n2.gid order by ST_Distance(n1.the_geom, n2.the_geom) limit 1 ) as dist FROM nodes n1 order by dist Spaital analysis in PostGIS based on VD/DT 24
Spaital analysis in PostGIS based on VD/DT • Nearest pair of points Spaital analysis in PostGIS based on VD/DT 25
Spaital analysis in PostGIS based on VD/DT • Find k nearest neighbors for each point in a given set of points. • Find medial axis/ skeleton for polygon: applied in finding the center line of roads, rivers (in spatial data digitization). • Find the minimum spanning tree: Using the Delaunay triangulation and Kruskal’s algorithm. • Find largest empty circle in a set of points: just compare the circles whose center is the Voronoi vertex. • Clustering/ Classification. Spaital analysis in PostGIS based on VD/DT 26
Some practical applications of the VD/DT • Business: A supermarket chain with many branches located in different locations. The branch managers want to send the discount leaflets to their customers. The question is how to partition the customer area so that the distance from each branch to its customer area is minimal compared to the other branches. The “customer area” is exactly the Voronoi cell of each branch. • Epidemiology: determine the impact area of an infectious disease case. Spaital analysis in PostGIS based on VD/DT 27
Some practical applications of the VD/DT • Environment: Suppose that the environmental manager need to build a garbage treatment within a residential area. The requirement is maximize the distance from the garbage treatment as possible to the residential houses. It can be solved by finding the largest empty circle based on Voronoi diagram. • Hydrology: Voronoi diagram is used to calculate the average rainfall of a basin (also known as Thiessen polygons). Introduction 28
Spaital analysis in PostGIS based on VD/DT Estimate the basin average rainfall: using Voronoi Diagram (aka: Thiessen Polygon) f1 , f2 : area of each Voronoi cell (contains the corresponding rainfall station) X1 , X2 : rainfall of each Voronoi cell F: Total area of the basin 29
Conclusion • This study just “gather” some “tips and tricks” to construct VD/ DT in PostGIS database and exploit it to enhance the spatial analysis functions in PostGIS. • This study may be not useful or bring interest to the end-users, but I think it can meet some GIS developers’ needs to manipulate and extend spatial analysis functions directly in DBMS. 30
Conclusion • The experiment in this study demonstrates the ability of using third-party functions to extend the spatial analysis capabilities in PostGIS (or PostgreSQL in general). In this case is the interoperation of: • PostGIS and R through PL/R language: thanks to the author of deldir package (Rolf Turner) and PL/R voronoi function (Mike Leahy). • PostGIS and jaspa through native SQL statement: thanks to the author of the jaspa extension and the built-in Delaunay function in jaspa template. 31
Conclusion Stand on the shoulders of giants Don’t reinvent the wheel 32
DEPARTMENT OF SCIENCE AND TECHNOLOGY HOCHIMINH CITY GIS CENTER THANKS FOR YOUR ATTENTION Q & A By Quach Dong Thang (M.Sc) Head of Techinical Division HoChiMinh City GIS Center HoChiMinh City Dept of Science & Technology Website: http://hcmgisportal.vn Asia geospatial forum 17-19 Sept 2012 Hanoi, Vietnam