Download
1 / 32
320 likes | 327 Views
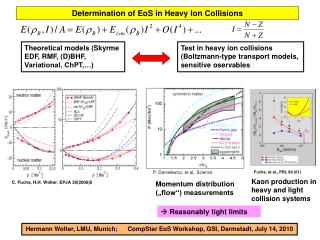
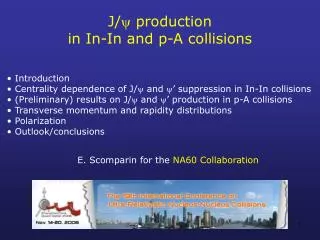
J/ Y ee and J/ Y mm Measurements in Au-Au and p-p Collisions at Ö s = 200A GeV. Quark Matter 2002, Nantes France, July 2002 A. D. Frawley Florida State University For the PHENIX Collaboration. Motivation.

E N D
J/Y ee and J/Ymm Measurements in Au-Au and p-p Collisions at Ös = 200A GeV Quark Matter 2002, Nantes France, July 2002 A. D. Frawley Florida State University For the PHENIX Collaboration
Motivation Began with prediction by Matsui and Satz (Phys. Lett. B178, 416 (1986)) that Debye color screening will lead to suppression of charmonium production in heavy ion collisions, if a quark-gluon plasma is formed. More recent predictions of increased J/Y production at RHIC from recombination. The best test is to measure charmonium yields in pp, pA, and AA PHENIX can measure charmonium decay yields to ee and mm for pp, pA and AA collisions with colliding beams of 100A GeV/c. First results from PHENIX for J/Y production at Ös = 200A GeV in pp and AuAu collisions will be presented in this talk.
PHENIX Experiment in Run 2 Electrons ( |h| < 0.35) Charged tracks (Beam-Beam, Drift Chamber, Pad Chambers) + RICH rings + EM Calorimeter clusters Muons (1.2 < h < 2.2) Muon Identifier roads + Muon Tracker tracks
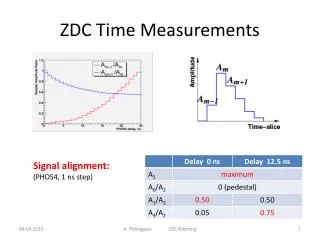
1000 nb-1 800 600 400 200 PHENIX 0 0 18 36 Days RHIC Integrated pp Luminosity RHIC vertex distribution was wide, only about 50% accepted by PHENIX online vertex cuts After online vertex cuts, PHENIX recorded 150 nb-1 Present preliminary analysis used data from: 81 nb-1(1.7 x 10⁹)mm 48 nb-1(1.0 x 10⁹) ee
PHENIX pp Analysis Posters H. Sato, "Measurement of J/Y -> m+m- in p+p Collisions at Ös = 200 GeV with the PHENIX experiment at RHIC" M.X. Liu, "Dimuon Production from Au Au Collisions at ÖsNN = 200A GeV" Wei Xie, "Study of J/Y -> e+e- in pp Collisions with level 1 Triggers in PHENIX"
pp ee J/Y Trigger J/Y trigger = minimum bias D level 1 Minimum Bias Trigger (+ offline vertex cut) BB > 1 and |Z| < 35 cm where BB > 1 means at least one hit in each Beam-Beam counter is required . Level 1 Trigger EMCal > 700 MeV in any 2 D 2 PMT "tile" ie. we use a single electron trigger with a 700 MeV threshold as our J/Y trigger.
Same plots as previously but now on a linear scale. p-p ee Invariant Mass Spectrum All triggers This analysis NJ/Y = 24 + 6 (stat) + 4 (sys) Bds/dy = 52 + 13 (stat) + 18 (sys) nb
Bee ds/dy|y=0 = NJ/Ytrue sinelastic Neventstrue A e dy Calculating p-p J/Y ee Yields A e = acceptance D (J/Y reconstruction eff. D level 1 trigger eff.) A e dy = 0.0128 + 17.5% (sys) NJ/Ytrue = NJ/Ymeasured/( J/Y fraction sampled by MB trigger ) = NJ/Ymeasured/( 0.75 + 0.11 (sys) ) Neventstrue = Neventsmeasured/(fraction of 42 mb sampled by MB trigger ) = Neventsmeasured/( 0.51 + 0.10 (sys) ) Neventsmeasured = (BBCLL1>1, |Z|<35 cm) D level 1 =1.037 D 109 Combined systematic = 35%
pp mm J/Y Trigger J/Y trigger = minimum bias D level 1 Minimum Bias Trigger (+ offline vertex cut) BB > 1 and |Z| < 38 cm where BB > 1 means at least one hit in each Beam-Beam counter is required . Level 1 Trigger 1 deep muon + 1 shallow muon in the Muon Identifier level 1 trigger.
pp mm Invariant Mass Spectrum 1.2 < y < 1.7 NJ/Y = 26 + 6 + 2.6 (sys) B ds/dy = 49 + 22% + 29% (sys) nb 1.7 < y < 2.2 NJ/Y = 10 + 4 + 1.0(sys) B ds/dy = 23 + 37% + 29% (sys) nb
Bmmds/dy|y=0 = NJ/Ytrue sinelastic Neventstrue dyA e Calculating p-p J/Ymm Yields NJ/Ytrue = NJ/Ymeasured/( J/Y fraction sampled by MB trigger ) = NJ/Ymeasured/( 0.75 + 0.11 (sys) ) Neventstrue = Neventsmeasured/(fraction of 42 mb sampled by MB trig ) = Neventsmeasured/( 0.51 + 0.10 (sys) ) Neventsmeasured = (BBLL1>1 with |Z|<38 cm) D level 1 = 1.72 + 0.09 x 10⁹ A e = acceptance D (J/Y reconstruction eff. D level 1 trigger eff.) A e D(0.75 + 0.11)= 0.0131 + 3% + 19% for y = 1.45, dy = 0.5 = 0.0108 + 3% + 19% for y = 1.95, dy = 0.5 Combined systematic on Bmm ds/dy = 29%
pp at 200A GeV J/Y Rapidity Distribution Gaussian and PYTHIA shape fits give essentially the same integral. The quoted result is the average of the two fits. s (pp->J/Y) = 3.8 + 0.6 (stat) + 1.3 (sys) mb
200A GeV pp J/Ymm Transverse Momentum distribution 1.2 < y < 2.2
PHENIX pp Cross Section vs Color Evaporation Model* * See J.F. Amundson et al., Phys. Lett. B 390 (1997) 323.
80 mb-1 40 0 60 88 4 32 0 28 Days RHIC Integrated AuAu Luminosity Only 50% of RHIC beam vertex distribution satisfied PHENIX online vertex cuts After online vertex cuts (+45 cm) and 60% PHENIX uptime, we recorded 24 mb-1. Present preliminary analysis uses minbias data only from 4 mb-1(26 x 106)for ee
Au Au ee J/Y Trigger J/Y trigger = minimum bias D level 2 Minimum Bias Trigger (+ offline vertex cut) BB > 2 and |Z| < 30 cm where BB > 2 means at least two hits in each Beam-Beam counter required . Level 2 Trigger Loose RICH/EmCal match to get electron candidates Require > 300 MeV in EMCal for electron candidates Require a confirming hit in Pad Chamber 3 Calculate invariant mass of all electron pairs Require invariant mass > 2.2 GeV/c
Au-Au ee Invariant Mass Spectra NJ/Y = 5.9 + 2.4 (stat) + 0.7 (sys) NJ/Y = 10.8 + 3.2 (stat) + 3.8 - 2.8 (sys)
NJ/Y = 3.5 + 1.9 (stat) + 0.5 (sys) NJ/Y = 4.5 + 2.1 (stat) + 0.5 (sys) N=3.5 +/- 1.9(stat) +/- 0.5 (sys) - 2.1(stat) +/- 0.5 (sys) Au-Au ee Invariant Mass Spectra
PHENIX Au-Au ee Analysis Poster T. Matsumoto, "Measurement of J/Y -> ee in AuAu Collisions at ÖsNN = 200 GeV at RHIC-PHENIX"
Bee ds/dy|y=0 = NJ/Ytrue sinelastic Neventstrue A e dy J/Y ee Analysis for Au Au Data dy A e = acceptance D J/Y reconstruction eff.D centrality dependence dy A e = 0.00407+0.0009 D 0.65 + 0.07 (00-20%) 0.76 + 0.08 (20-40%) 0.86 + 0.09 (40-90%) NJ/Ytrue = NJ/Ymeasured (within 0-90% centrality) Neventstrue = Neventsmeasured = minbias events in the centrality bin = 25,902,950D (centrality bin width in %) / 90% NJ/Ymeasured extracted using 7 different fitting procedures to establish systematic errors
200A GeVAu-Au J/Y ee Statistical errors are standard deviations Systematic errors are maximum plausible systematic spreads in values Systematic errors are partly correlated among all points
200A GeVAu-Au J/Y ee Are our data consistent with binary scaling? A confidence level of 16% says that a truly flat distribution would produce a fit as poor as this in 16% of cases. So it probably trends down with increasing Npart, but don't bet the farm!
200A GeVAu-Au J/Y ee Fit of normal nuclear absorption curve to our data has high confidence level ------ BUT See next slide!!
200A GeVAu-Au J/Y ee We can not discriminate between scenarios, given our present statistical accuracy All curves normalized to pp data point (bit of a hoax) Phys. Lett B 521 (2002) 195
Summary PHENIX has measured J/Y yields at Ös = 200A GeV for: pp -> ee and AuAu -> ee in -0.35 < h < +0.35 pp -> mm in 1.2 < h < 2.4 Preliminary results were presented here from an analysis of about 1/2 of the pp data, and about 1/2 of the AuAu data Clearly, we will need improved statistics to draw any conclusions about J/Y suppression at RHIC
Future J/Y Plans Remaining data from Run 2 will ~ double yields Systematic errors will be reduced also Goals in the next two years( after vertex cuts) : 300 mb-1 for Au-Au ( ~ 75 times present analysis) 8 pb-1 for p-p ( ~ 100 times present analysis) 14 nb-1 d-Au (comparable yield to p-p and Au-Au) See d-Au poster by David Silvermyr Note that we have two muon arms from now on!
Nucleus A zprod zA J/Y zB zprod Nucleus B Normal Nuclear Absorption of J/Y Survival probability = PA . PB zA,B PA,B = p exp(-rsJ/Y-N z) dz zprod where r = local nucleon density sJ/Y-N = J/Y-on-nucleon s sJ/Y-N = 7.1 + 0.9 mb from a fit to CERN A . B data (Bennett and Nagle reference here)
p-A data Dimuon pair absorption vs. target mass. The results are consistent with an absorption cross section of zero for Drell-Yan and different non-zero absorption cross sections for the onia. Drell-Yan leads to direct lepton pair formation, with no intermediate vector meson. Thus no absorption is expected.
J/Ymm decays measured / expected CERN SPS results (NA50, NA38, NA51) (eg. Physics Of Atomic Nuclei 65, 325 (2002)) Expected J/Y yields are corrected for "ordinary" nuclear absorption assuming 6.4 mb absorption cross section Many arguments about whether this is strong evidence of QGP at SPS energies, but it is clearly VERY interesting!
Final value N = 24 +/- 6 (stat) +/- 4 (sys) We take the like sign functional form and a gaussian signal form and get a good fit to the final spectra. We have also done fits with bkg as exponential with various binning and fit ranges (1-4, 2-4, etc.) and find all results well within range 20-26 counts.